

Update: Monograph released the 2026 Architecture & Engineering Business Benchmarks Report, now with AI adoption data and more firms than ever. Get free access →
As an architect or architecture firm owner, staying on top of industry benchmarks is crucial to running a healthy business. Utilization rate is one of the most direct indicators of whether your team's time is being converted into billable revenue, and the 2026 data tells a more interesting story than any prior year.
This article draws on first-party data from the 2026 Architecture & Engineering Business Benchmarks Report, built from anonymized data across 856 A&E firms for this specific metric.
Decoding Utilization Rate: What it means for architects
What is Utilization Rate?
Utilization rate measures the efficiency of a workforce. Firm-wide utilization rate calculates the proportion of billable hours worked by all employees compared to total hours worked across the firm. Role-based utilization rate assesses the same proportion for a specific role, such as principals, project managers, engineers, or administrative staff.
Put simply: how much of your team's available time is going toward work you can actually bill for?
This is not to be confused with Realization Rate, which measures what percentage of billable work actually gets collected as fees. Utilization tells you how much billable work is happening. Realization tells you how much of it gets paid.
How is Utilization Rate calculated?
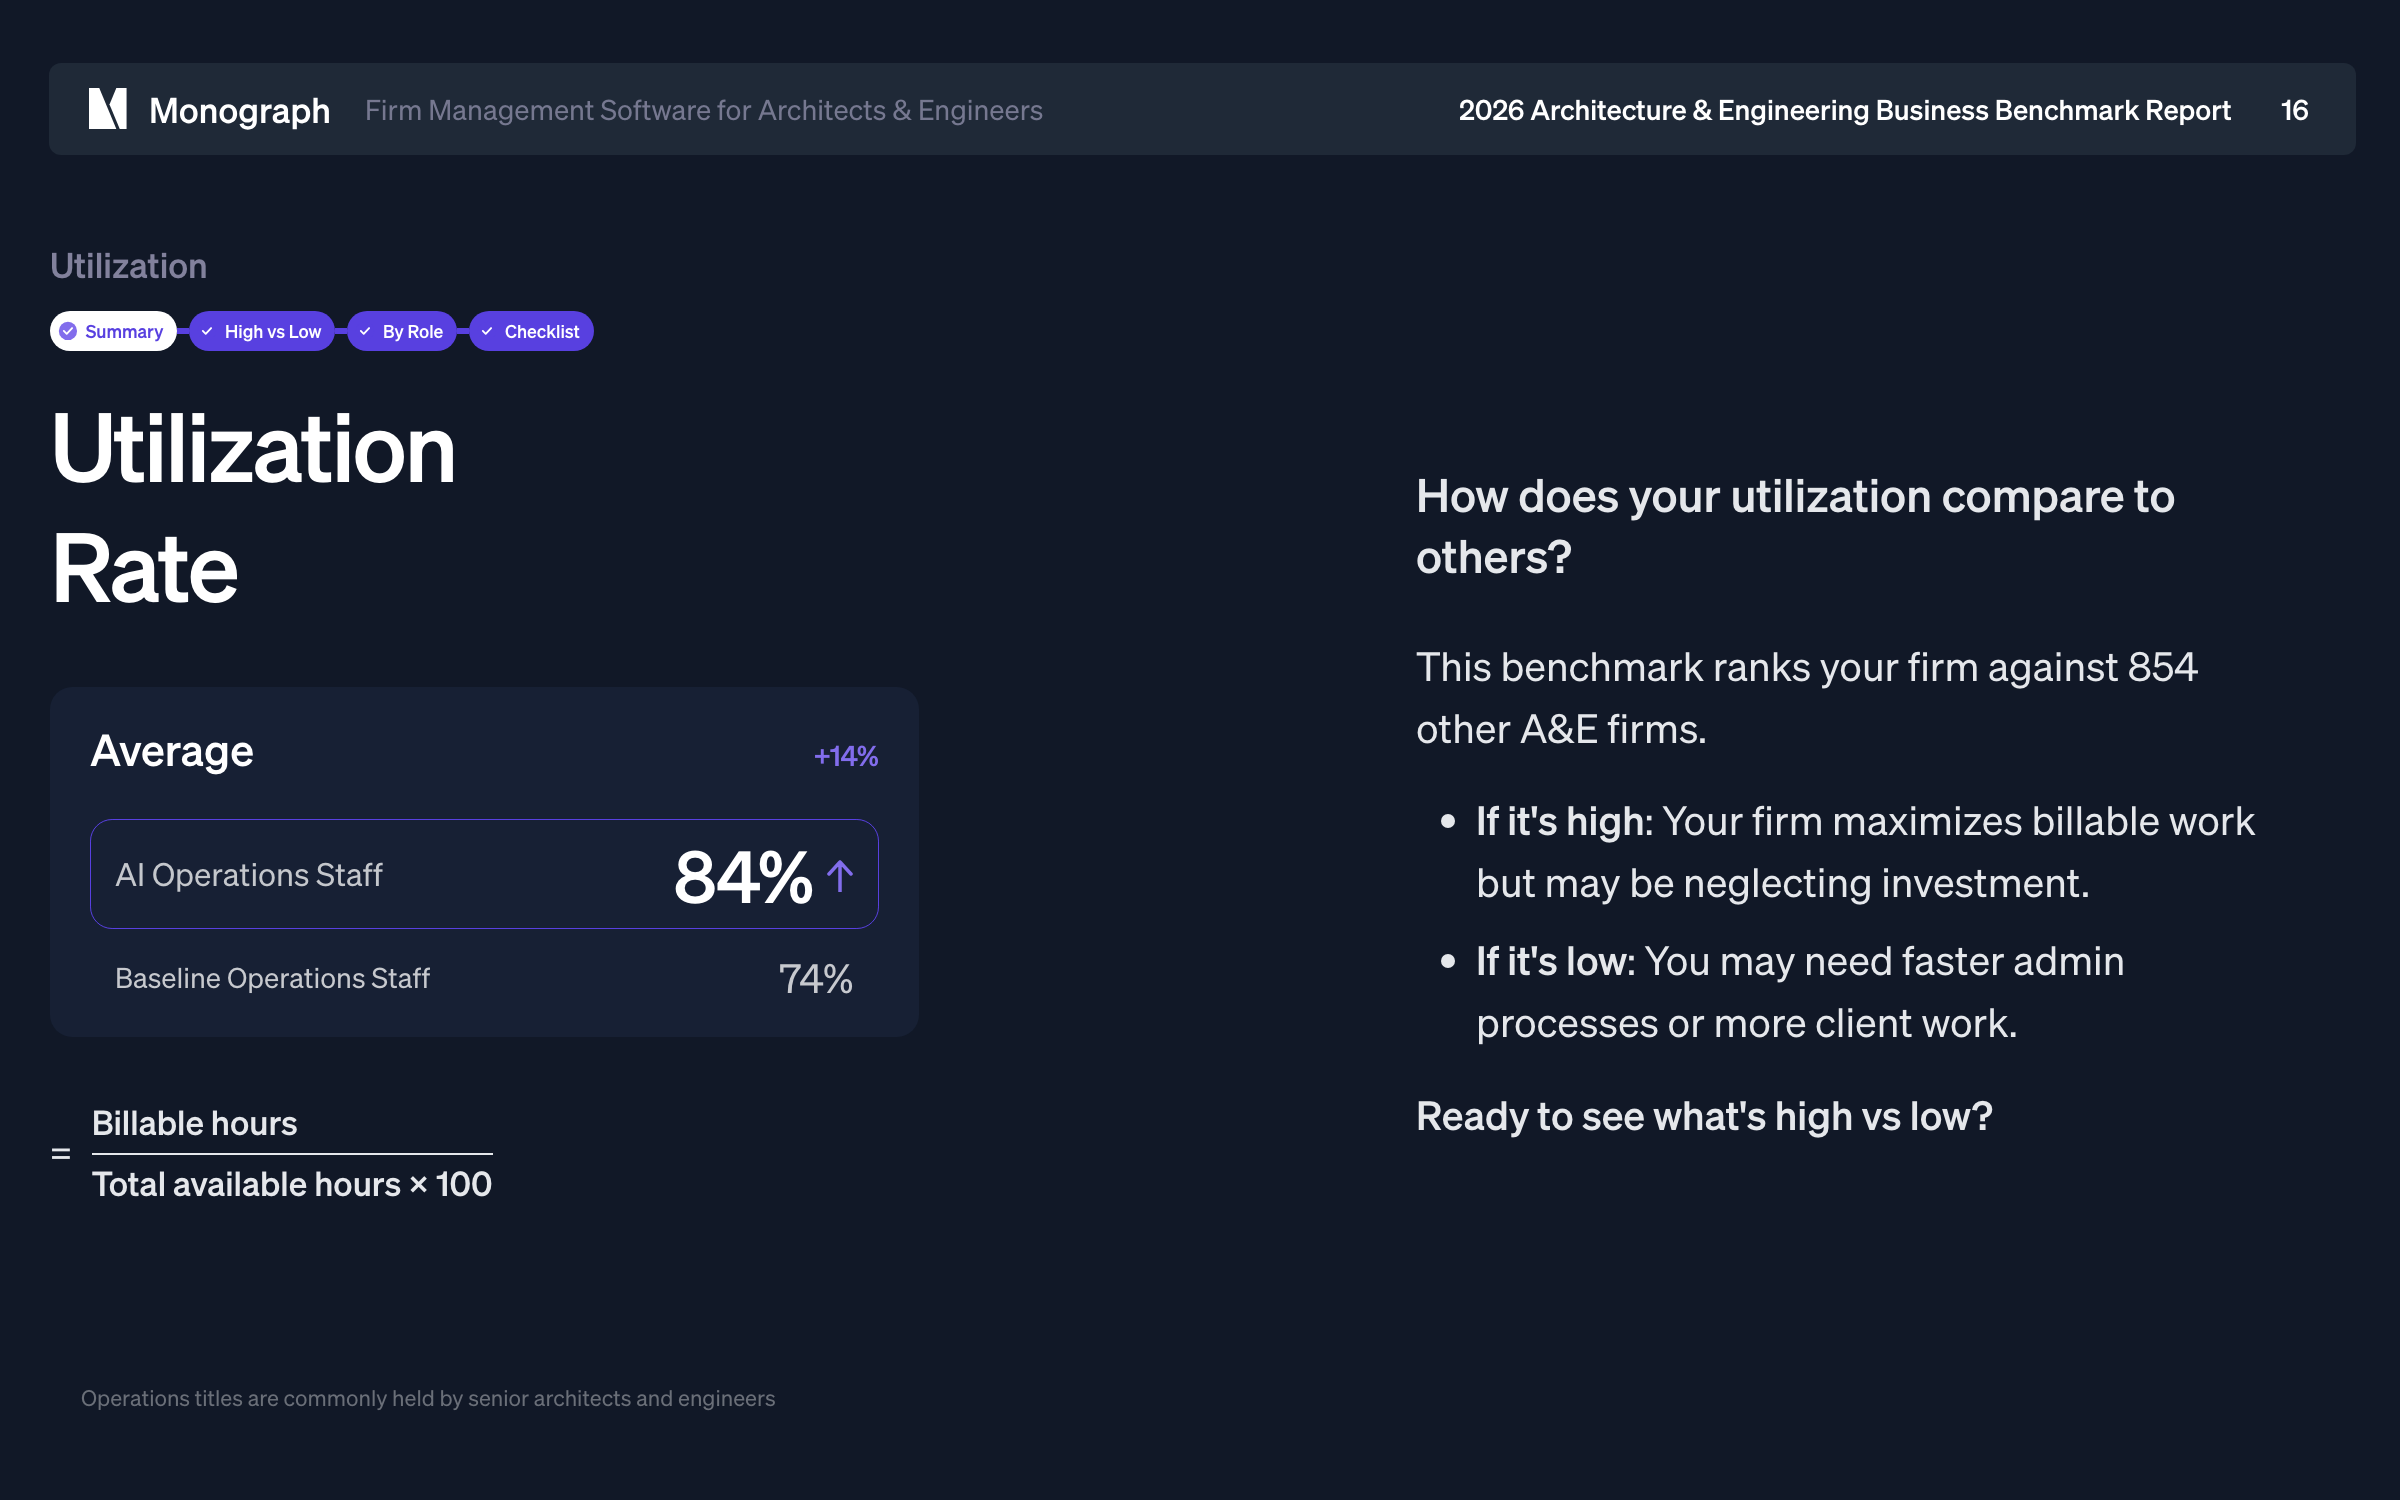
Utilization rate is calculated by dividing total billable hours by total available hours, then multiplying by 100. It is one of the most straightforward metrics to track and one of the most powerful for diagnosing where firm capacity is being lost.
Why is Utilization Rate important for architects?
Firm-wide utilization rate gives you an overall picture of how effectively your firm is deploying its workforce. Role-based utilization helps you identify which roles are most productive and where improvements are needed, which is especially important for setting realistic billable hour targets and managing workload without burning people out.
"Utilization Rate can empower you to understand if your team is spending the right amount of time on billable work vs non-billable activities."
Lucas Gray, Director of Business Development & Senior Business Consultant at Charrette Venture Group
2026 Utilization Rate benchmarks for architecture firms
Average Utilization Rate
The industry-recommended benchmark for utilization has historically been around 75%. The 2026 data shows that firms using Monograph are performing considerably above that threshold.
The average utilization rate across A&E firms is 81% for baseline firms, rising to 84% for operations staff at AI-adopting firms.
That gap matters. AI firms are running their operations staff 14% higher than baseline peers, meaning those firms are converting time that used to go to admin work into billable hours instead.
Top and bottom Utilization Rates
The spread between high and low performing firms is significant and reflects fundamentally different approaches to capacity planning.
- High performance (top quartile, baseline): 92–94%
- Average: 81% (baseline) / 84% (AI operations staff)
- Median: 81–82%
- Low performance (bottom quartile): 67–70%
The sweet spot the data points to is 75% to 90%, enough billable work to stay profitable, while preserving room for business development, training, and long-term investment. Firms above 90% risk burnout and underinvestment in growth. Firms below 60% have significant capacity sitting idle.
One of the most notable findings: top firms log 10 more billable hours per person per week than bottom quartile firms. That is not a rounding difference , it is the difference between a firm that is thriving and one that is treading water.
Utilization by role
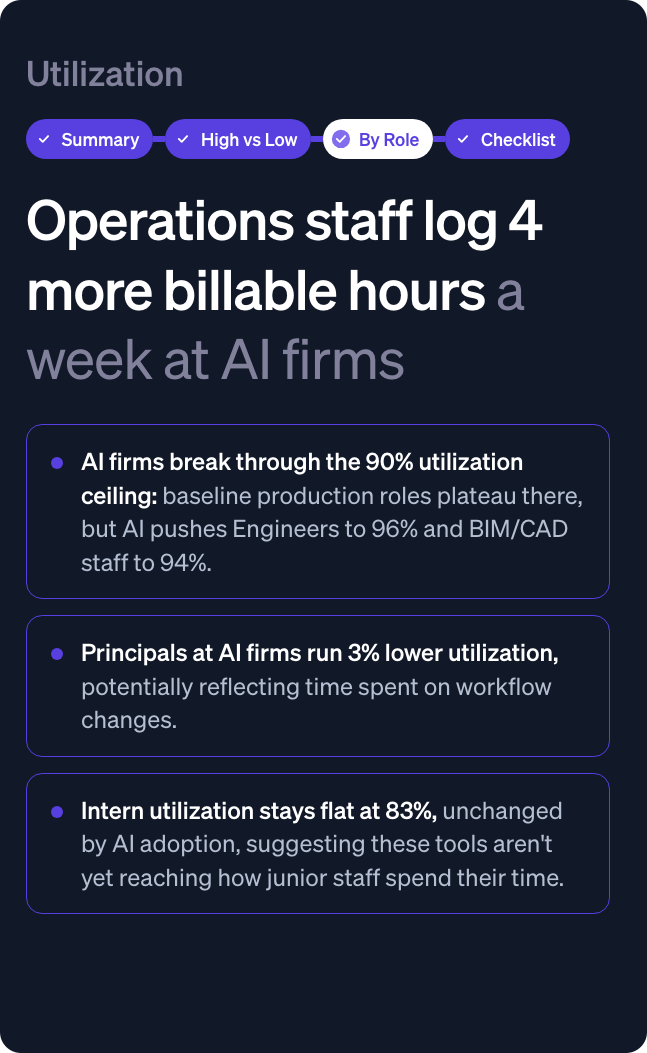
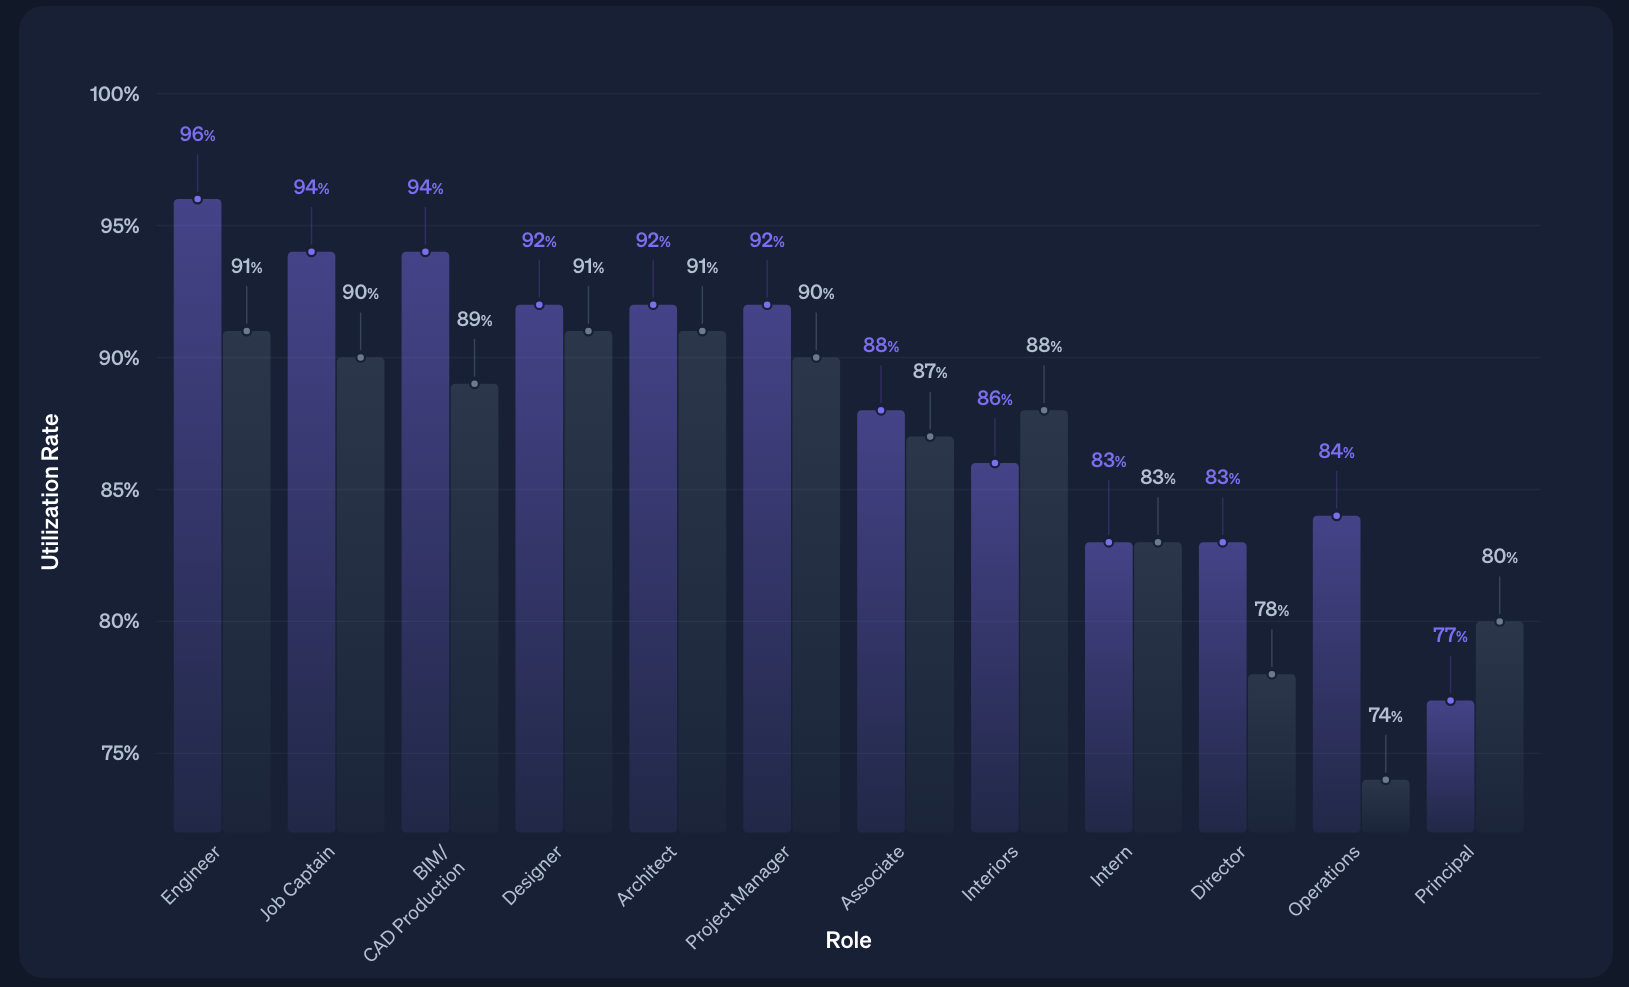
The 2026 report breaks utilization down by role for the first time with AI cohort comparisons, and the findings are striking.
- Engineers at AI firms run 96% utilization, 5% higher than their baseline peers, showing AI adoption lifts billable time across technical roles
- BIM/CAD production staff at AI firms run 94% compared to 90% at baseline
- Principals at AI firms run 4% lower utilization than baseline, likely reflecting time spent implementing and managing new AI workflows
- Intern utilization is flat at 83% regardless of AI adoption, suggesting AI tools are not yet changing how junior staff spend their time
The headline finding: AI firms break through the 90% utilization ceiling that typically plateaus production roles at baseline firms. Operations titles held by senior architects and engineers are the roles seeing the biggest lift.
What makes Utilization Rates higher for Monograph users?
The benchmarks in this report are based on first-party data from Monograph users, which is worth noting. Monograph is a project management platform built exclusively for architecture and engineering firms. Its real-time tracking and easy-to-use reports mean that firms spend far less time on administrative, non-billable tasks and more time on billable work after switching.
For example, after switching to Monograph:
- Garrison Architects, a 9-person firm in Brooklyn, reduced time spent on monthly invoicing by 66%
- Woodhull, a design-build firm in Portland, reduced time spent on scheduling reports by 95%
Each of these time savings flows directly into higher utilization.
What AI is doing to utilization rates
For the first time, the 2026 report identifies firms investing in AI tools and compares their utilization performance. The results are specific and actionable.
AI tools are primarily freeing up operations staff, the senior architects and engineers who manage workflows, run reports, and handle administrative coordination alongside project work. At AI firms, those roles are running 14% higher utilization than their counterparts at baseline firms. The time that used to go to non-billable admin is now going to billable work.
The tradeoff shows up at the principal level, where AI firms run slightly lower utilization, likely because principals are spending time selecting, implementing, and integrating new tools. The report treats this as an investment in future capacity rather than a loss.
The practical implication: if you are evaluating AI adoption, utilization is one of the clearest metrics to watch before and after. The firms seeing the biggest gains are those where operations roles had the most non-billable time to recapture.
How can architects improve Utilization Rate?
A higher Utilization Rate is not always better
Achieving 100% utilization is not a goal worth pursuing. A firm running at or near 100% is overworked, leaving no room for business development, training, or strategic investment. The data shows firms above 90% risk burnout and reduced investment in growth. The target is a healthy range, not a maximum.
Conversely, a utilization rate that is consistently below 60% to 70% suggests the firm either is not securing enough project work or has capacity that is not being effectively directed toward billable activities.
5 ways architects can improve Utilization Rate
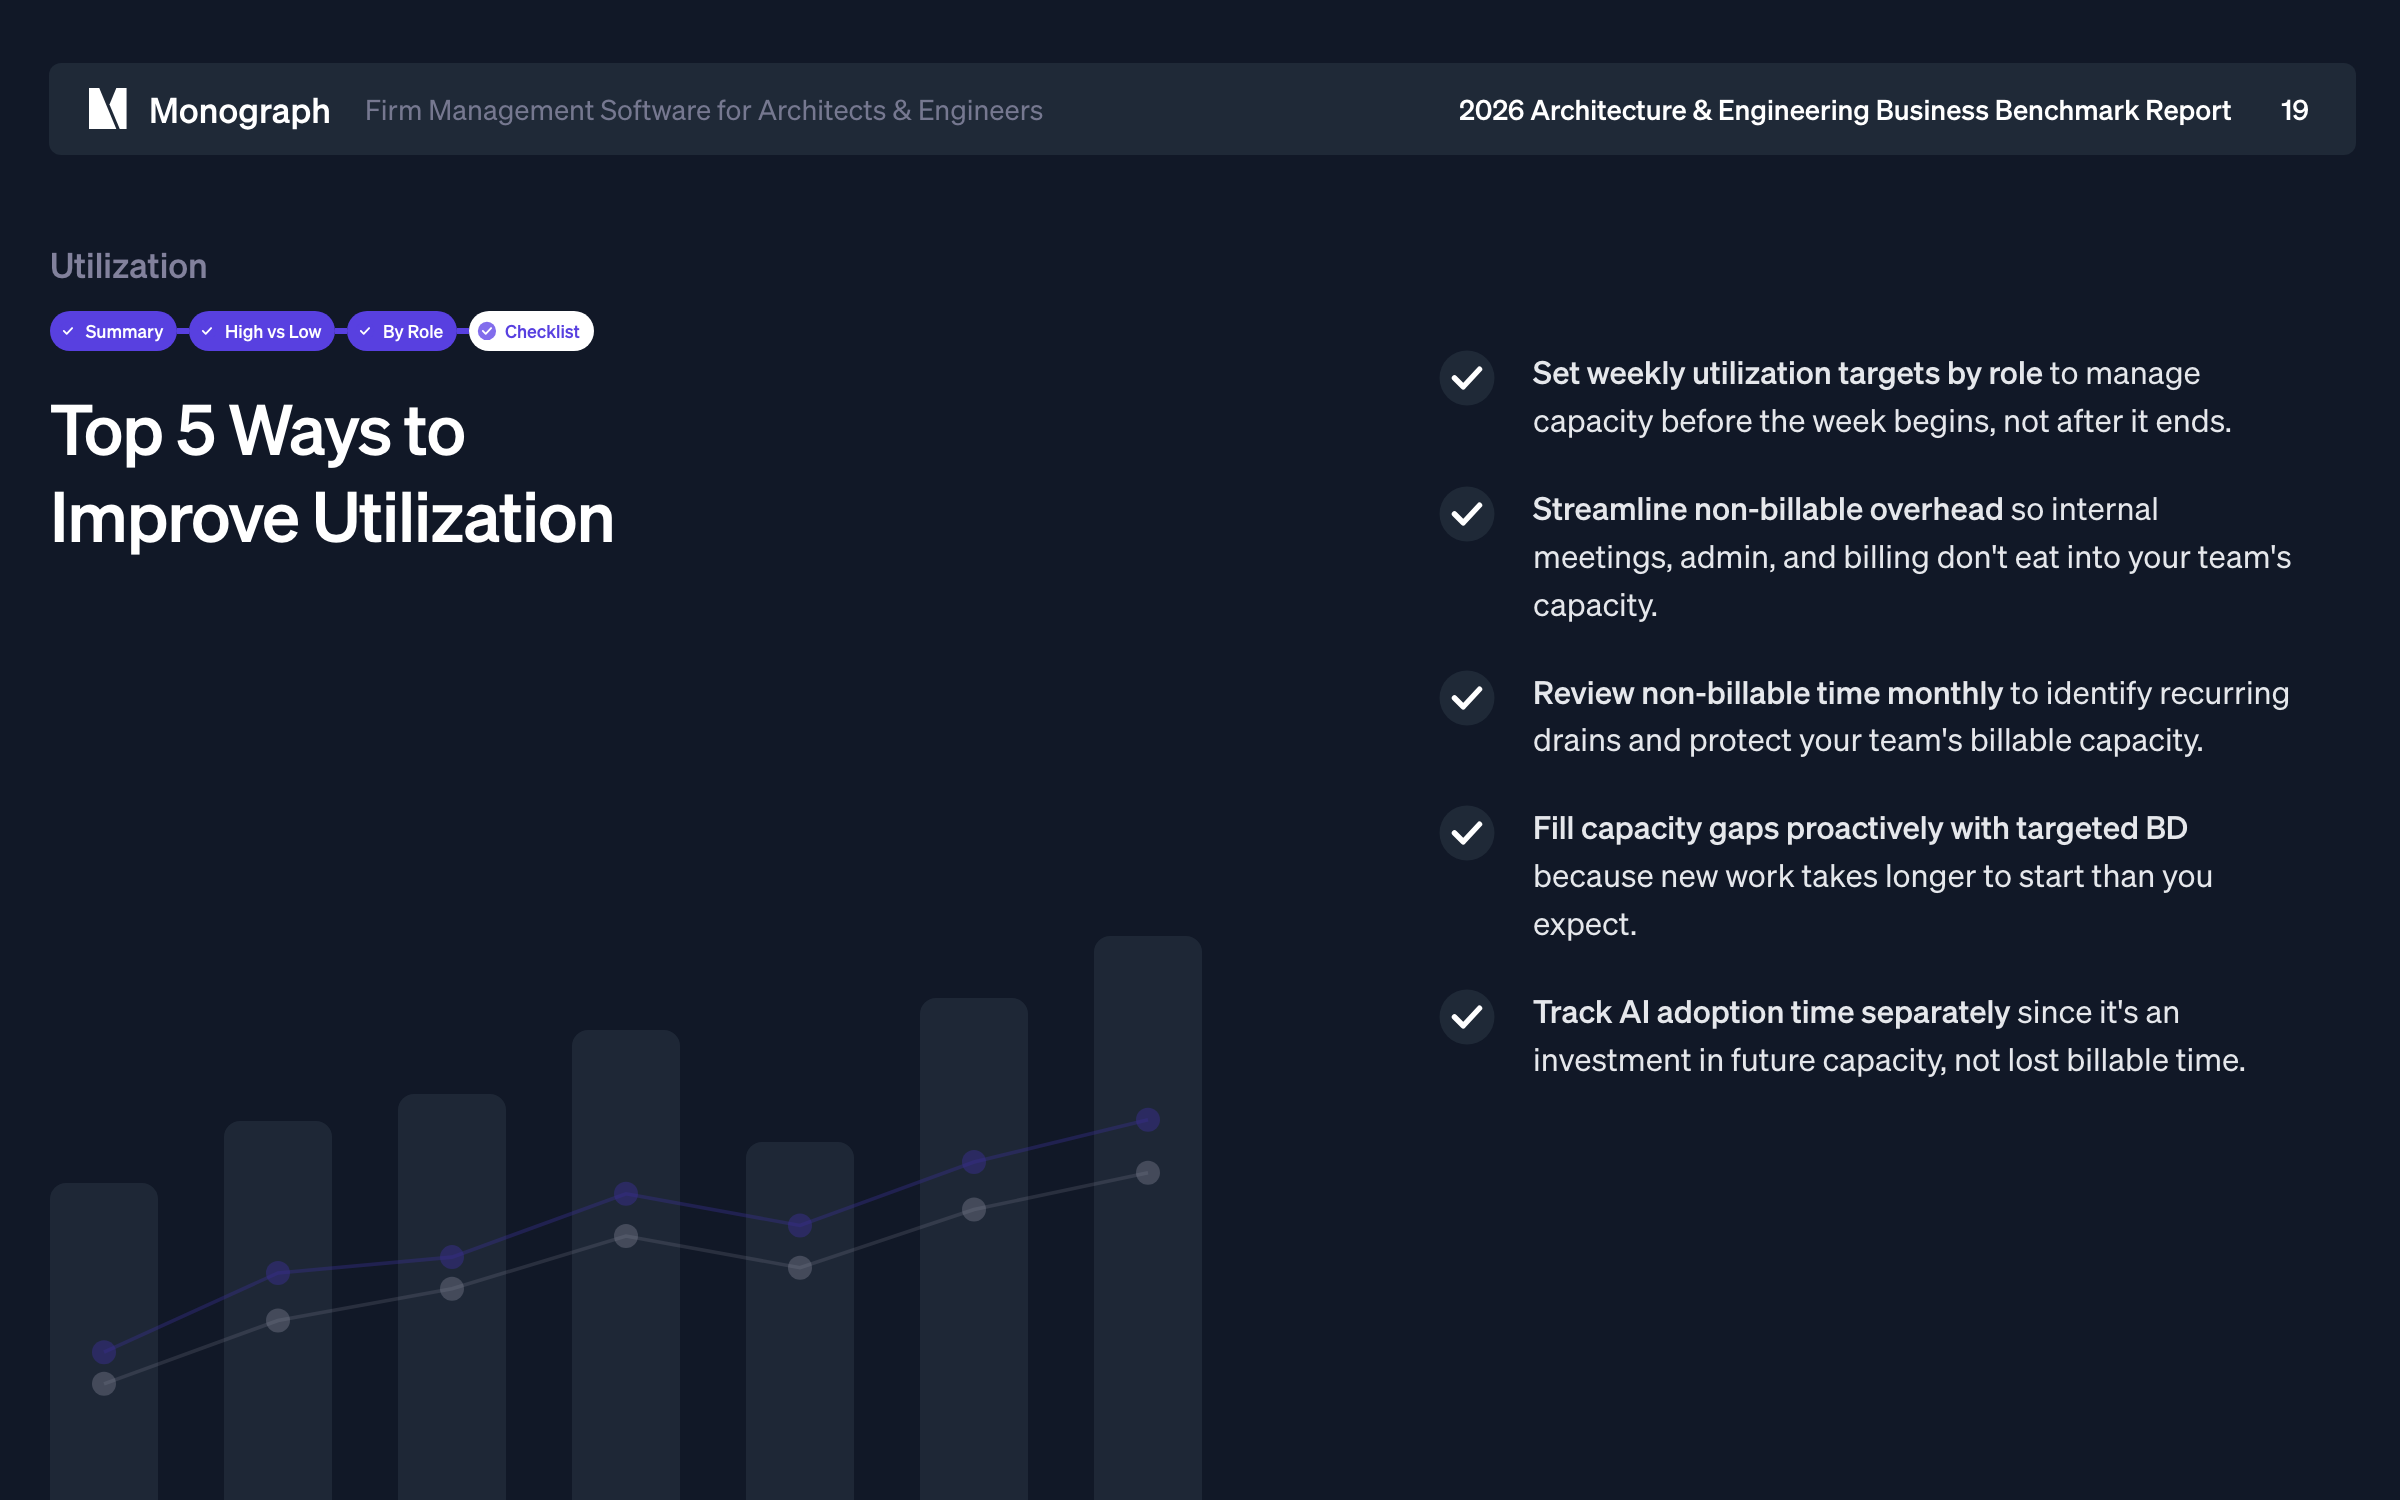
The 2026 report's checklist for improving utilization is more specific than prior years:
- Set weekly utilization targets by role to manage capacity before the week begins, not after it ends. Knowing where you stand on Monday is the difference between course-correcting and discovering a problem on Friday.
- Review non-billable time monthly to identify recurring drains and protect your team's billable capacity. The same non-billable activities tend to show up month after month.
- Fill capacity gaps proactively with targeted business development - new work takes longer to start than you expect, so pipeline decisions made today affect utilization 60 to 90 days from now.
- If principals are spending time on AI workflows, track it separately as an investment in future capacity rather than lost billable time. Burying it in non-billable time makes the investment invisible.
- Track utilization by role to catch burnout at the top and underuse at the bottom before both become problems. A firm-wide average can mask very different situations across the team.
Next steps
The 2026 Architecture & Engineering Business Benchmarks Report covers six core metrics, Revenue, Cost, Salary, Utilization, Realization, and Cash Flow, plus new sections on AI adoption, seasonality, and collaboration. It's free and built from first-party data from 15,000+ architects and engineers using Monograph.
Download it to see exactly where your firm stands, then use the included checklist to prioritize the improvements with the highest impact for your situation.
When you're ready to track utilization in real time rather than once a year, Monograph gives you a live view of billable vs. non-billable hours across every role and every project in your firm.


