

Update: Monograph released the 2026 Architecture & Engineering Business Benchmarks Report, now with AI adoption data and more firms than ever. Get free access →
Let's take a deep dive into one of the most vital Key Performance Indicators for architecture firms: Net Revenue per Full-Time Equivalent (FTE). Drawing from Monograph's 2026 Architecture & Engineering Business Benchmarks Report, we're breaking down what this metric means, what the numbers look like today, and what the highest-performing firms are doing differently. This guide will equip you with the knowledge to evaluate where your firm stands and the strategies to improve it.
"The benchmark in the report that I believe will have the most significant impact on how architecture firms will operate and succeed in the next five years is Net Revenue per FTE. With many recent conversations around fees, AI, and automation, thinking through how architecture firms can evolve our services and the roles of each individual contributor will be reflected in this benchmark."
Julia Gamolina, Founder and Editor-in-Chief of Madame Architect
Here is what this guide covers:
- The core concept of Net Revenue per FTE and why it matters
- How to calculate and evaluate your own number
- 2026 benchmarks: how firms stack up
- What AI-adopting firms are doing differently
- Strategies to increase your firm's Net Revenue per FTE
Decoding Net Revenue per Full-Time Equivalent: What it means for architects
What is Net Revenue per Full-Time Equivalent?
Net Revenue per FTE measures an architecture firm's operational efficiency by showing how effectively revenue is being generated relative to the full-time equivalent workforce. A full-time equivalent refers to one employee working full-time, or multiple part-time employees whose combined hours equate to a full-time position.
Put simply, Net Revenue per FTE assesses a firm's efficiency in generating revenue with its staff. In architecture firms, where project-based work is the norm, this metric offers clear insight into how effectively your people are actually driving revenue.
How is Net Revenue per FTE calculated?
Net Revenue per FTE is calculated by dividing your annual net revenue by the number of full-time equivalent employees. It's a simple calculation with significant implications.
Why is Net Revenue per FTE important for architects?
Net Revenue per FTE reveals the productivity and efficiency of your staff in generating income. It helps you understand whether your firm is overstaffed or understaffed for the volume of work you're handling, and it aids in strategic planning, resource allocation, and understanding your competitive position.
"As a first look at how well a business is doing, Net Revenue per FTE is very useful. Low numbers often mean the business is overstaffed, their fees are too low, or there isn't enough work. It doesn't tell us everything, but for architecture businesses who are focused on it and striving to understand the different factors in their operations that are impacting it, it provides an excellent guide."
Rion Willard, Director of Consulting and Business Transformation at Business of Architecture
2026 Net Revenue per FTE benchmarks for architecture firms
The following data comes from the 2026 Architecture & Engineering Business Benchmarks Report, based on anonymized first-party data from Monograph across 660 A&E firms.
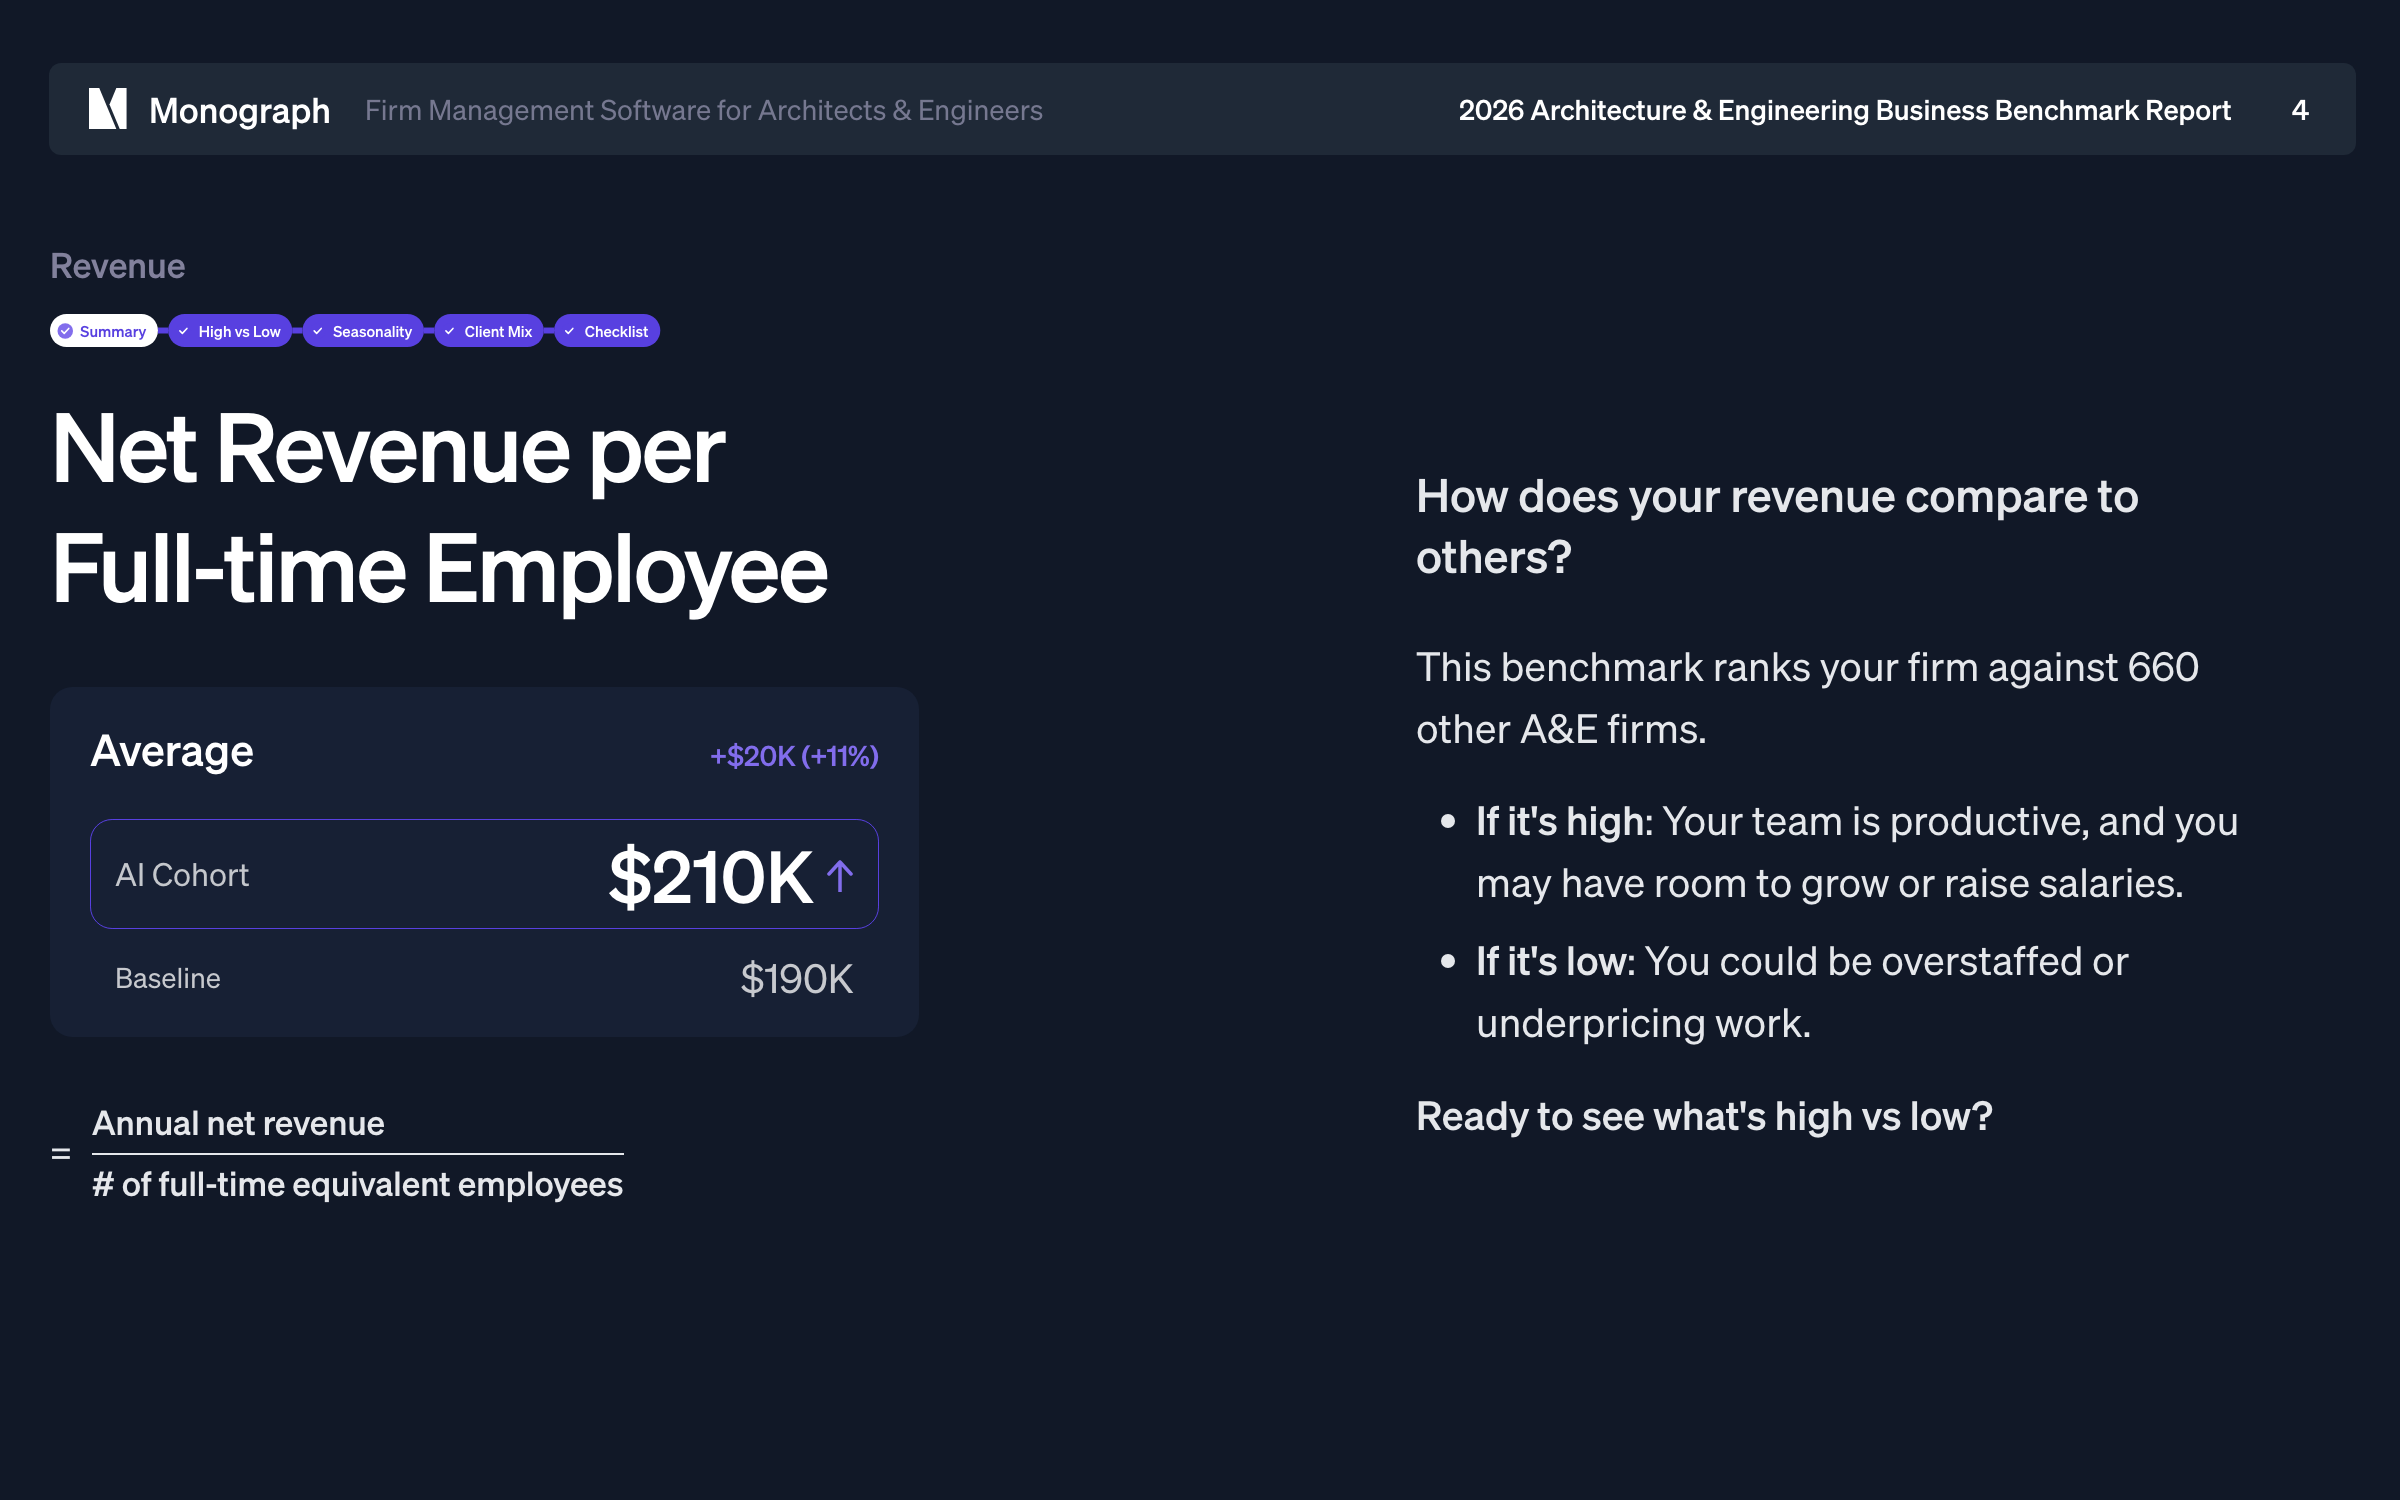
Average Net Revenue per FTE
The average net revenue per FTE is $190K for baseline firms, rising to $210K for firms investing in AI tools which is a $20K gap that compounds quickly at any firm size.
That difference reflects more than just technology adoption. AI-adopting firms are also running more efficient operations, capturing more of the fees they scope, and freeing up staff time for billable work. The result is meaningfully more revenue generated per person.
One of the most striking findings from the 2026 report: top firms using AI generate $130K more per employee than low-performing firms without it, a gap that is up 30% from last year. The spread between the best and worst performers has never been wider.
Top and bottom Net Revenue per FTE benchmarks
The range between high and low performers is significant and worth understanding in detail.
- High performance (top quartile, AI cohort): $269K per FTE
- High performance (top quartile, baseline): $228K per FTE
- Average: $190K (baseline) / $210K (AI cohort)
- Median: $177K (baseline) / $196K (AI cohort)
- Low performance (bottom quartile): $130K–$153K per FTE
The spread between the top and bottom quartile is nearly $96K per FTE, almost a full salary per employee in unrealized revenue sitting on the table. That is not a marginal difference. It reflects fundamentally different approaches to pricing, staffing, utilization, and how work gets done.
Industry guidance has historically suggested that firms aim for around $150K net revenue per FTE. The 2026 data shows that number is now the median for baseline firms, meaning half of all firms are below it and half are above. If you're at $150K, you're no longer ahead, you're at the midpoint.
What makes Net Revenue per FTE higher for Monograph users?
The data in this report comes directly from Monograph users, which is worth noting. Monograph is a project management platform built exclusively for architecture and engineering firms. Because of its real-time tracking, easy-to-use reports, and simplified staffing tools, firms using Monograph are able to manage projects and firm health more effectively, avoiding many of the common business pitfalls that drag down revenue per FTE.

For example, after switching to Monograph:
- Verdant Studio, a 12-person architecture firm in Arkansas, spends 80% less time planning project budgets and timelines
- Rossmann Architecture, a 30+ person firm in Quebec, tripled revenue over a 9-month period
- Garrison Architects, a 9-person firm in Brooklyn, reduced time spent on monthly invoicing by 66%
These efficiency gains translate directly into higher net revenue per FTE.
What AI is doing to net revenue per FTE
For the first time, the 2026 report identifies firms investing in AI tools and compares their performance across every metric. The results on net revenue are the most striking finding in the report.
AI-adopting firms average $210K per FTE versus $190K at baseline, which isa $20K advantage. But the real story is at the top. High-performing AI firms hit $269K per FTE, compared to $228K for high-performing baseline firms. That $41K gap at the top quartile is double the $20K average gap, meaning AI amplifies the best performers most.
What's driving this? The report points to three specific mechanisms:
- 14% higher utilization for operations staff at AI firms, as AI tools free up time previously spent on non-billable tasks
- 4% higher realization, meaning AI firms capture more of the fees they scope rather than losing them to write-offs and scope creep
- $20K more revenue per employee against only $5K more in cost — a 4-to-1 return on incremental AI investment
The practical implication: firms that are already running efficient operations get the most lift from AI. It is not a fix for underlying problems with pricing or utilization — it's an amplifier for firms that have those things dialed in.
How can architecture firms improve Net Revenue per FTE?
Understanding how Net Revenue per FTE impacts business performance
A high net revenue per FTE signals that your team is productive and your fees reflect the value you deliver. It creates room to invest in growth — better talent, better tools, new markets without straining margins. A low number forces hard choices: cut costs, raise prices, or both, often at the wrong time.
The 2026 data makes the relationship between investment and return clear. Firms spending slightly more per employee on AI tools are earning significantly more per employee in return. The instinct to cut costs to improve margins is often exactly backwards.
5 ways architects can improve Net Revenue per FTE
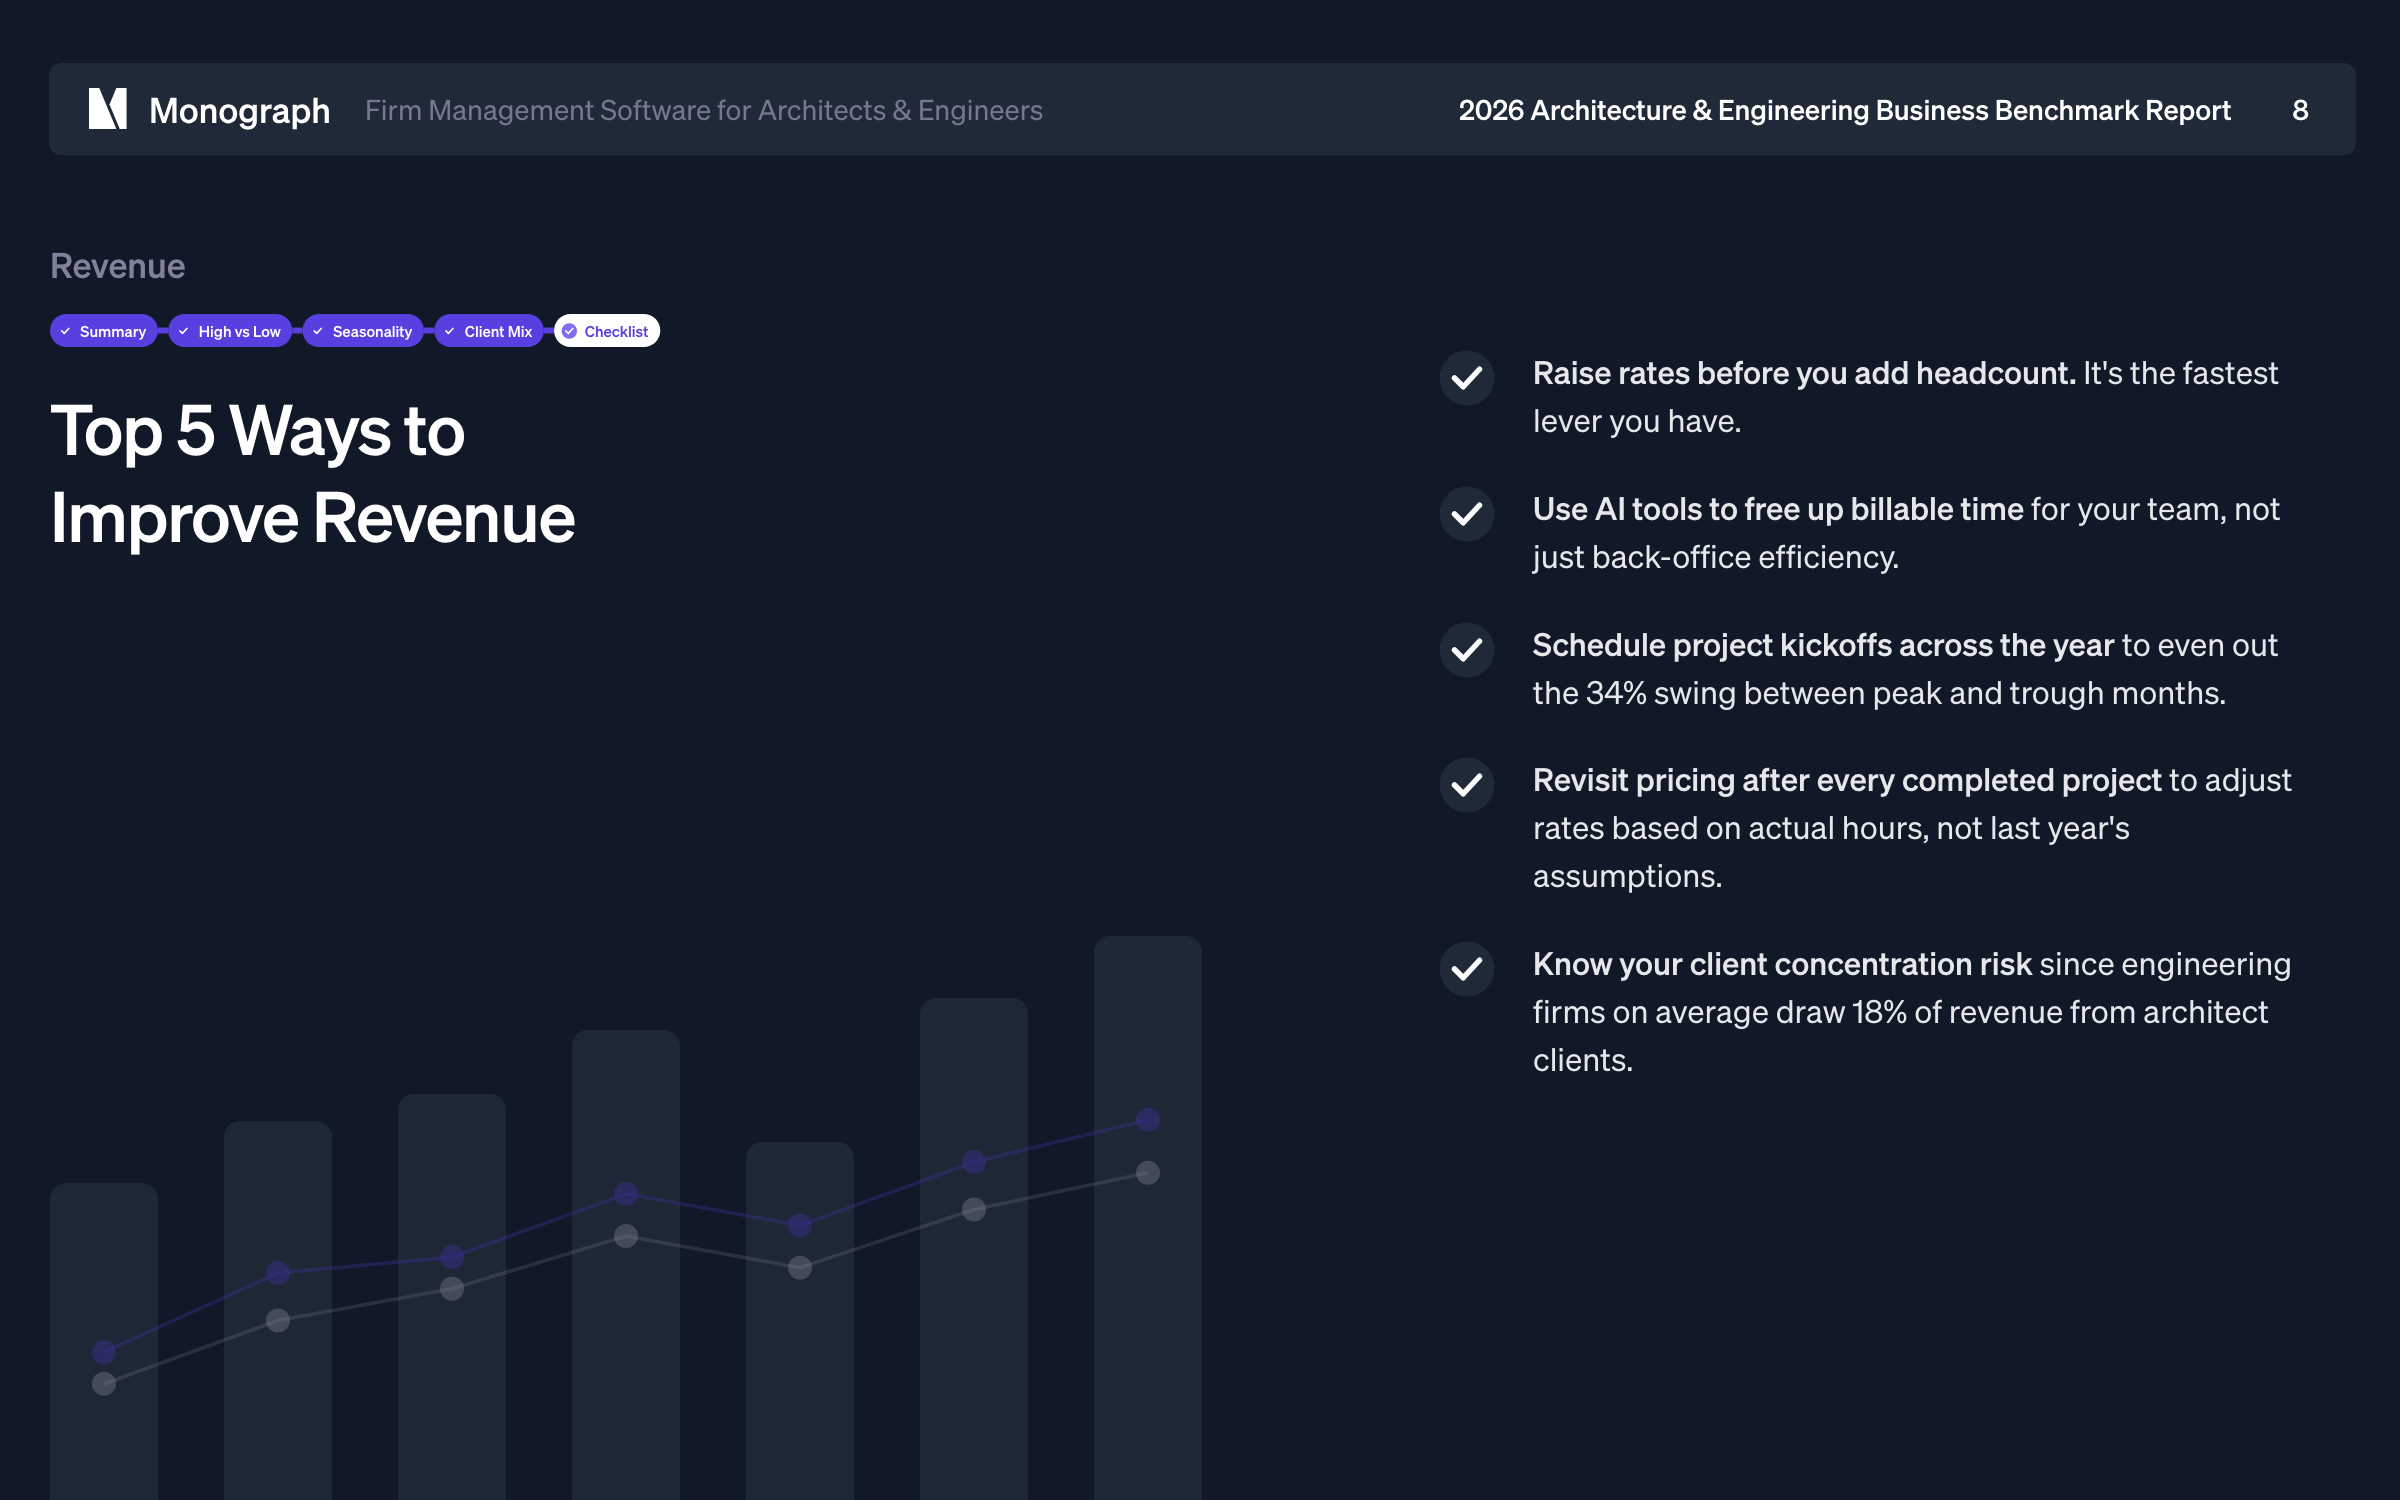
The 2026 report's checklist for improving revenue per FTE is more specific than in prior years:
- Raise rates before you add headcount, it's the fastest lever you have. Adding staff without raising rates dilutes your revenue per FTE immediately.
- Use AI tools to free up time for billable work, firms using AI are running 14% higher utilization on operations staff, time that was previously non-billable.
- Send proposals 60 to 90 days before May and October peaks, the report identifies these as the strongest billing months, running 10 to 14% above average. Getting work contracted before those months is the difference between capturing that peak and missing it.
- Fill your backlog in January: March is the worst billing month of the year. Firms that use the slow start of Q1 to build pipeline hit the May peak in a much stronger position.
- Diversify away from a single client type, the report shows that 18% of engineering revenue comes from architect clients, making those firms vulnerable to architecture slowdowns. Architecture firms face an equivalent risk with any dominant client category.
Next steps
The 2026 Architecture & Engineering Business Benchmarks Report covers six core metrics Revenue, Cost, Salary, Utilization, Realization, and Cash Flow, plus new sections on AI adoption, seasonality, and collaboration. It's free and built from first-party data from 15,000+ architects and engineers.
Download it to see exactly where your firm stands, then use the included ultimate checklist to identify the improvements with the highest impact for your specific situation.
When you're ready to track net revenue per FTE in real time rather than once a year, Monograph gives you a live view of every metric in this report across every project and every person in your firm.


