

Update: Monograph released the 2026 Architecture & Engineering Business Benchmarks Report, now with AI adoption data and more firms than ever. Get free access →
Architects and architecture firms understand well that every dollar counts. It's not just about design. It's about the financial management that allows your firm to do more of the work you love. The Net Cost per Full-Time Equivalent (FTE) is one of the most essential measures of how effectively your firm manages its resources, and the 2026 data tells a more nuanced story than ever before.
But what exactly does this measure encompass? Why is it so crucial? And how can you work toward improving your firm's net cost per FTE, including what AI-adopting firms are doing differently? In this article, we draw on first-party data from the 2026 Architecture & Engineering Business Benchmarks Report, built from 15,000+ architects and engineers using Monograph across 774 firms for this specific metric.
Here's what we'll cover:
- Understanding Net Cost per FTE: The what, why, and how of this essential financial measure
- 2026 Benchmarking Data: Updated top, bottom, and average figures from the latest report
- What AI is doing to cost: New findings on how AI-adopting firms spend differently and what they earn for it
- Tips for Improvement: Practical strategies for bringing your cost per FTE into a healthy range
Understanding Net Cost per Full-Time Equivalent: What it means for architects
Understanding the nuances of business metrics is an integral part of running a successful architecture firm. Net Cost per FTE holds a wealth of information, helping you evaluate the effectiveness of your resource allocation and the overall financial health of your practice.
What is Net Cost per FTE?
Net Cost per FTE measures the average cost incurred by a firm for each full-time equivalent employee. It includes all costs, operational, administrative, and otherwise, both direct and indirect, associated with each FTE. This metric provides a comprehensive view of the financial impact of staffing on your firm's overall expenses.
How is Net Cost per FTE calculated?
Net Cost per FTE is calculated by dividing your annual net cost by the number of full-time equivalent employees.
Why is Net Cost per FTE important for architects?
Net Cost per FTE helps you assess the efficiency and cost-effectiveness of your staff. It provides a clear picture of how much it costs to employ each team member, accounting for salaries, benefits, taxes, and overhead. Firms use it to identify areas where they may be overspending, evaluate the return on investment of their people, and make informed decisions about hiring, resource allocation, and cost management.
In general, a high net cost per FTE may indicate inefficiencies in your firm's operations, while a low net cost per FTE suggests effective cost management, assuming your team is fully supported and productive. That last part matters, because as the 2026 data shows, the lowest-cost firms aren't always the best-performing ones.
This is also not to be confused with Net Revenue per FTE, which measures output rather than input. The two metrics together tell you whether your firm is running efficiently. High revenue per FTE paired with controlled cost per FTE is the combination you're aiming for.
2026 Net Cost per FTE benchmarks for architecture firms
The following data comes from the 2026 Architecture & Engineering Business Benchmarks Report, based on anonymized first-party data from Monograph. The cost benchmark covers firms with 3 to 30 staff, $10K to $3M in total compensation, and an overhead multiplier between 1 to 3x over the last 12 months (n=774).
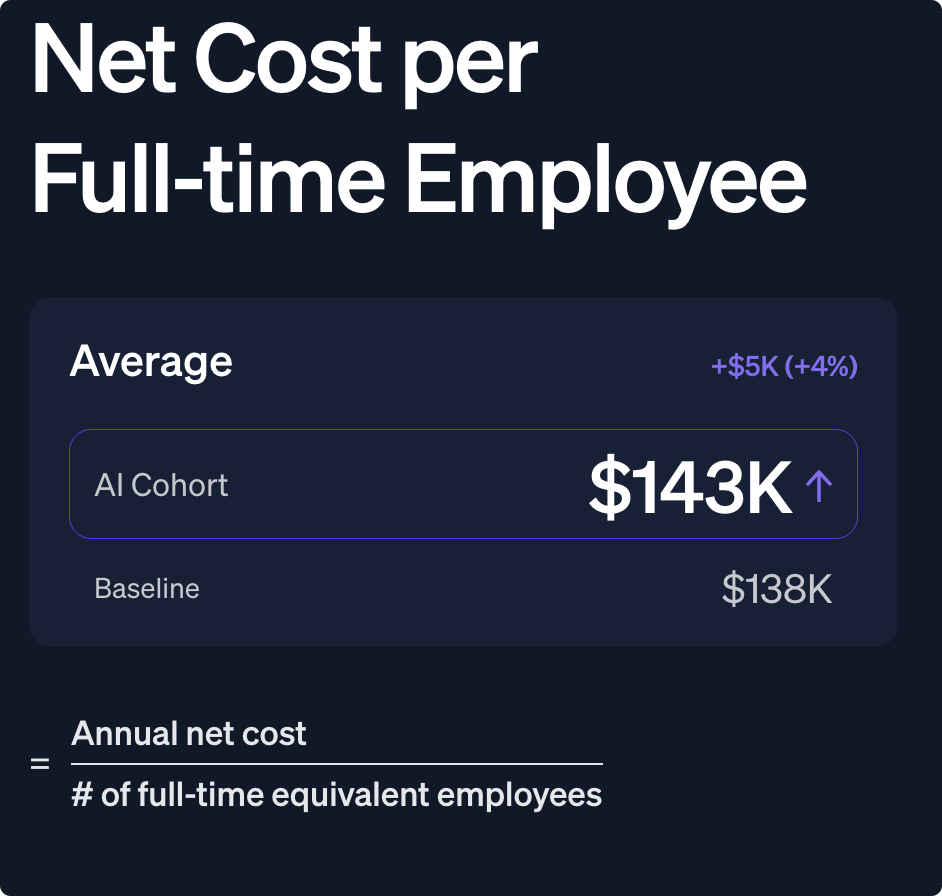
Average Net Cost per FTE for architecture firms
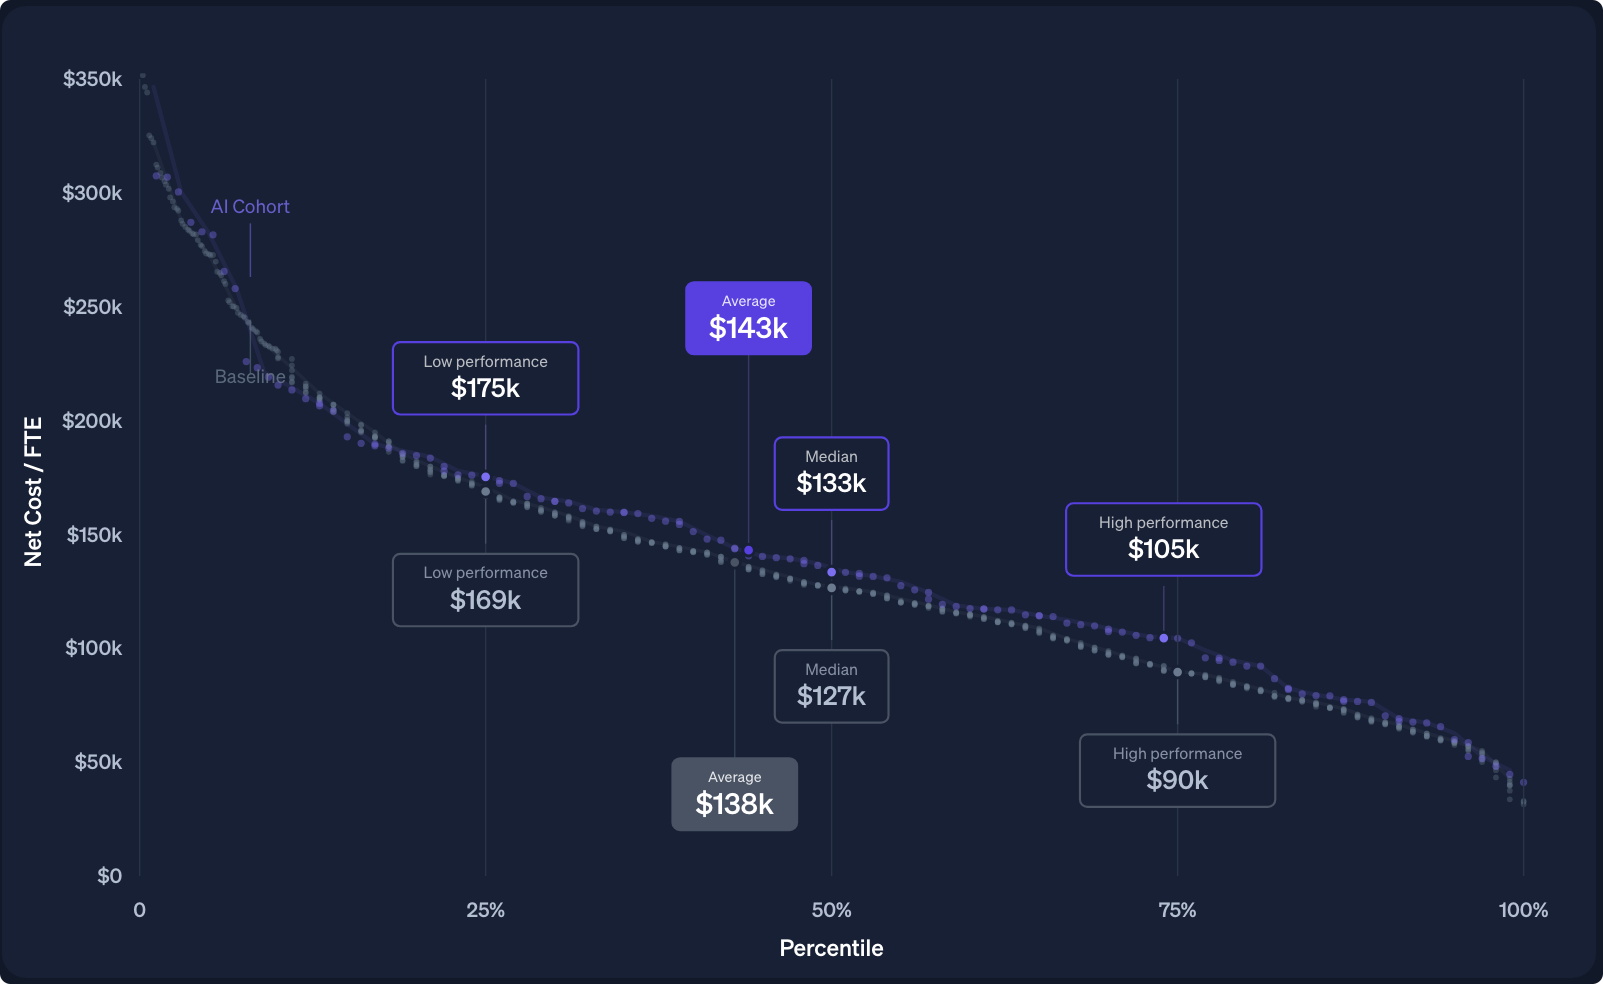
The average net cost per FTE across A&E firms is $138K for baseline firms, rising to $143K for firms investing in AI tools, a 3.9% premium that reflects investment in better tooling and more skilled talent.
That $5K gap might look like a cost disadvantage at first. It isn't. AI-adopting firms net $15K more margin per employee after accounting for their higher costs, a 3:1 return on incremental spend. The firms paying slightly more per person are earning significantly more per person as a result.
One of the most important headline findings from 2026: costs grew just 0.5% year-over-year while revenue grew 5.4%. That means the industry's profit margin improved structurally this year. Firms that held costs flat while growing revenue are now meaningfully more profitable than they were 12 months ago.
[Use page 9 — Net Cost per FTE summary slide]
Top and bottom Net Cost per FTE benchmarks
The spread between high and low cost firms is significant, with nearly $90K per FTE separating the most and least efficient firms in the dataset.
- High performance (top quartile): $90K to $105K per FTE — lean and efficient, with margin available to reinvest in growth, talent, and tools
- Median: $127K to $133K per FTE depending on AI adoption
- Low performance (bottom quartile): $169K to $175K per FTE — reflecting fundamentally different team structures and overhead models
That $90K spread represents dramatically different approaches to how firms are built and run. High-cost firms aren't necessarily paying people more. They're often carrying overhead structures that don't scale cleanly with revenue.
The floor matters too: don't optimize too far
One finding in the 2026 report worth calling out explicitly: firms with a net cost per FTE below $95K are often underinvesting in the tools and talent that drive revenue. The data suggests that cutting cost per FTE below that threshold tends to show up as lost performance on the revenue side.
The goal isn't the lowest possible cost per FTE. It's the most productive ratio of cost to revenue, and the 2026 data is clear that firms trying to run too lean pay for it in unrealized revenue.
What AI is doing to cost at architecture firms
For the first time, the 2026 report identifies firms investing in AI tools and compares their performance across every metric, including cost. The findings are more nuanced than a simple "AI saves money" story.
AI firms spend $143K per employee on average versus $138K at baseline, so they're spending more, not less. Where the advantage shows up is in what they get for that spend. Specifically:
- 11% lower back-office salaries at AI firms, as AI tools reduce the need for senior administrative talent
- 14% higher utilization for operations staff, as AI frees up time previously spent on non-billable tasks
- 4% higher realization, meaning AI firms capture more of the fees they scope
The net result is $15K more margin per employee after accounting for higher costs, a 3:1 return. AI isn't cutting costs at the line-item level. It's restructuring where costs go and increasing the productivity of the dollars being spent.
If you're evaluating AI tool adoption for your firm, the cost benchmark is one place to watch the impact over time. Firms that adopt AI well tend to see back-office costs compress while production and operations costs hold or rise slightly, a healthy shift that improves overall margin.
What your cost mix tells you
Beyond the total cost per FTE number, the 2026 report breaks down how architecture firms allocate costs and how that differs from engineering firms.
For architecture firms, costs break down roughly as: 56% employee costs, 17% consultant costs, and 27% other overhead. That consultant share is the defining characteristic of how architecture firms deliver work. The prime/sub model, where architects win the client relationship and bring in engineers and specialty consultants, is embedded in the cost structure.
This has a direct implication for how you manage and interpret your cost per FTE. If your consultant spend is rising as a share of total costs without a matching increase in revenue, that's a signal worth investigating. A rising consultant share without revenue growth typically means you're subbing out unbilled scope, paying for work your firm isn't capturing fees for.
Match your consultant spend to your delivery model and audit it regularly. It's one of the fastest places to find margin leaking out quietly.
[Use page 11 — the cost mix comparison chart between architecture and engineering firms]
How architecture firms can improve Net Cost per FTE
Understanding how Net Cost per FTE impacts business performance
Firms with a lower, well-managed net cost per FTE can reinvest savings into the services and talent that differentiate them. Efficient cost management creates room to invest in growth, whether that's new markets, better tools, or stronger compensation packages that attract and retain top people.
Conversely, a high net cost per FTE strains resources and limits a firm's ability to respond to market changes. It can push firms into a difficult position: cut corners to save costs and risk quality, or raise prices and risk losing work. Neither is a good path.
The firms in the top quartile of this dataset have figured out that cost efficiency and revenue growth aren't in conflict. They reinforce each other. Lower cost per FTE creates the margin to invest in what grows revenue.
5 ways architecture firms can improve Net Cost per FTE
The 2026 report's checklist for cost improvement is more specific than prior years:
- Challenge a low cost per FTE below $95K because it often means underinvesting in the tools and talent that drive revenue, and it shows up in performance over time.
- Match your consultant spend to your delivery model because a rising consultant share without a matching revenue increase means you're subbing out unbilled scope.
- Audit senior staff assignments above $185K per FTE to confirm they're on projects that justify their rate.
- Put your margin surplus into tools or retention since revenue grew 5.4% while costs grew just 0.5%, meaning firms that are running well have real margin to deploy right now.
- Track cost at the project level, not just firm-wide because that's where overspend hides, and firm-wide averages can mask individual projects that are quietly dragging down your overall efficiency.
Next steps
The 2026 Architecture & Engineering Business Benchmarks Report covers six core metrics, Revenue, Cost, Salary, Utilization, Realization, and Cash Flow, plus new sections on AI adoption, seasonality, and collaboration. It's the most comprehensive first-party benchmark dataset ever published for A&E firms, and it's free.
Download it to see exactly where your firm stands, then use the included checklist to identify the highest-leverage improvements available to you right now.
When you're ready to track these metrics in real time and stop relying on annual reports to find out where you stand, Monograph gives you a live view of cost, revenue, utilization, and realization across every project and every person in your firm.


