

When architecture and engineering firms are compared side by side, most people assume their cost structures look roughly similar. They don't. The difference is significant, structural, and if you're running an engineering firm, something you can actively use to your advantage.
The 2026 Architecture & Engineering Business Benchmarks Report breaks down cost mix by firm type, and the gap between how architects and engineers spend money is larger than most principals expect.
The Numbers: Two Very Different Cost Models
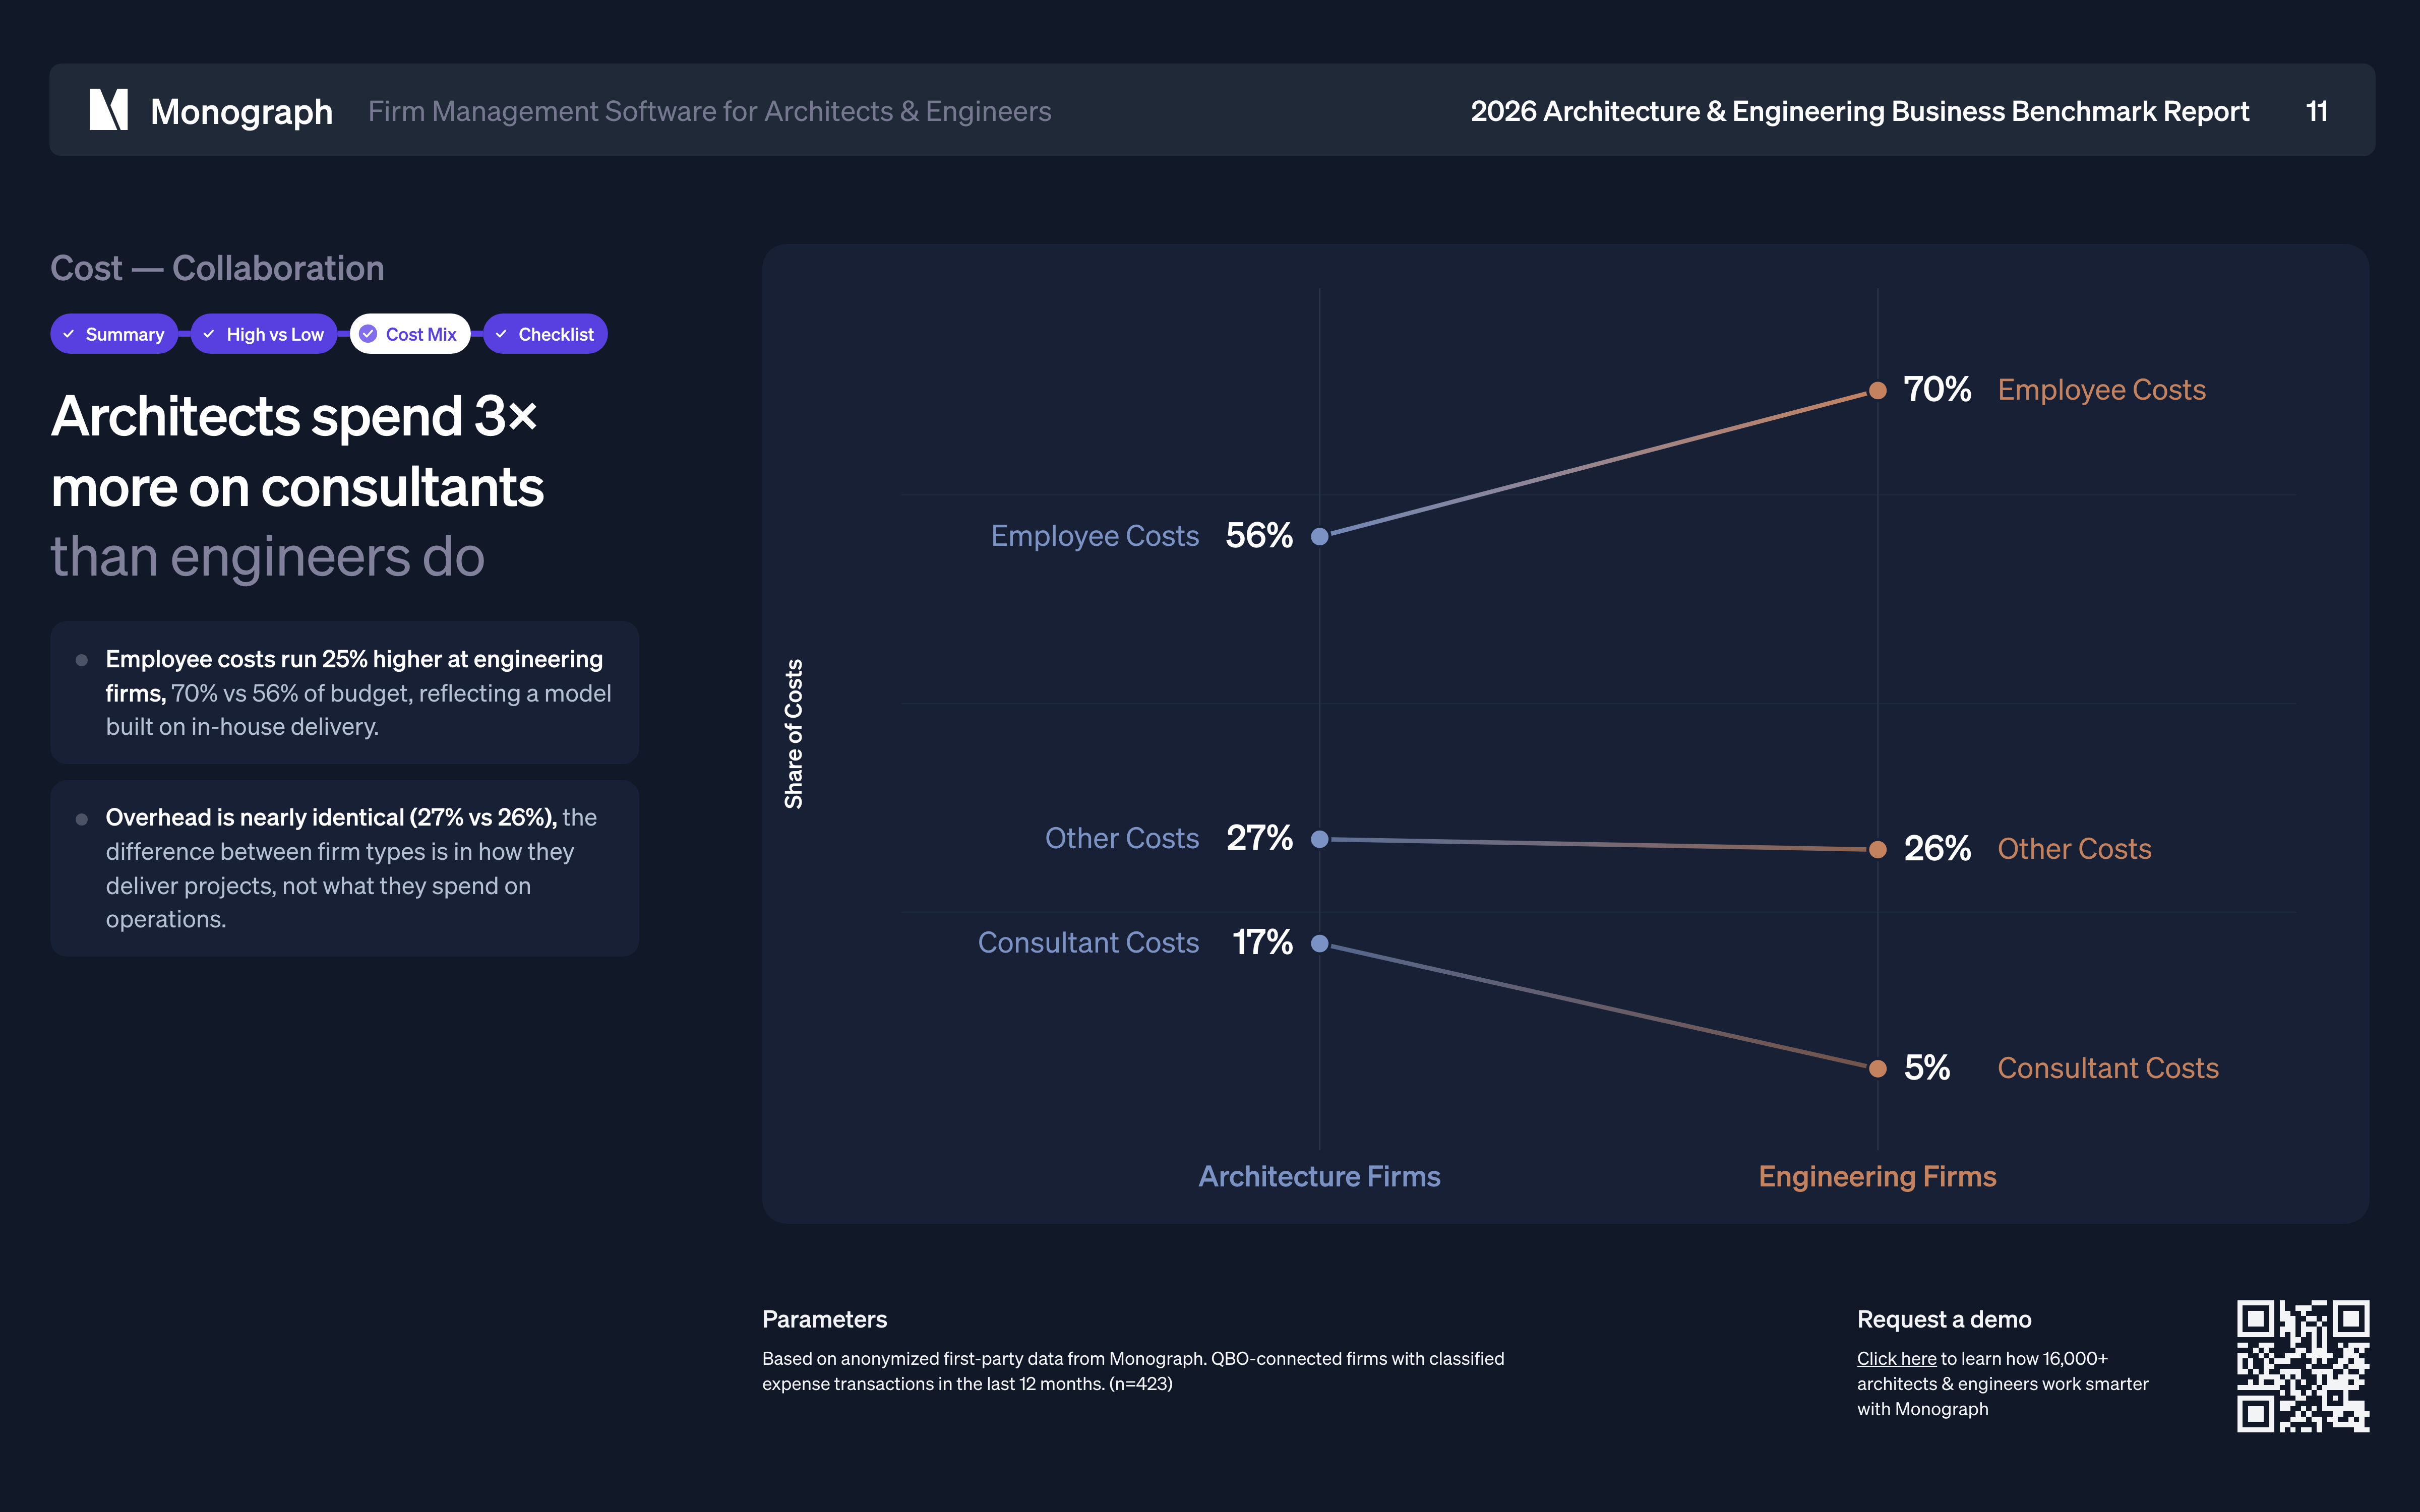
The average net cost per full-time employee across A&E firms is $138K at baseline, rising to $143K for firms investing in AI tools. But the composition of that cost tells a more interesting story than the total.
For engineering firms, roughly 70% of costs go to employees, 5% to consultants, and 26% to other overhead. For architecture firms, the split looks completely different: 56% to employees, 17% to consultants, and 27% to overhead.
That is not a small gap. Architects spend more than three times what engineers spend on consultants as a share of their cost base. And that difference reflects something fundamental about how each firm type delivers work.
What Your Cost Mix Actually Tells You About Your Business
Architecture firms operate heavily on a prime/sub model. They win the client relationship, scope the project, and then bring in engineers, specialty consultants, and other subconsultants to deliver the technical work. Consultant spend is baked into how they do business.
Engineering firms, by contrast, deliver most of their work in-house. Your team does the work. That 70% employee cost share is not a liability. It is a sign that your firm is capturing more of the value it creates rather than passing margin out to subconsultants.
The practical implication: your cost efficiency lives or dies on how well you staff and utilize your in-house team. Every dollar you pay an underutilized engineer is a dollar that is not generating billable output. But every dollar you pay a well-utilized engineer is working harder for your margin than the equivalent consultant spend would be at an architecture firm.
The High vs. Low Performance Gap Is $90K Per FTE
Across A&E firms in this dataset, the spread between P25 and P75 cost per FTE is about $90K, from roughly $127K to $133K at the median, down to $90K to $105K at high performance, and up to $169K to $175K at low performance.
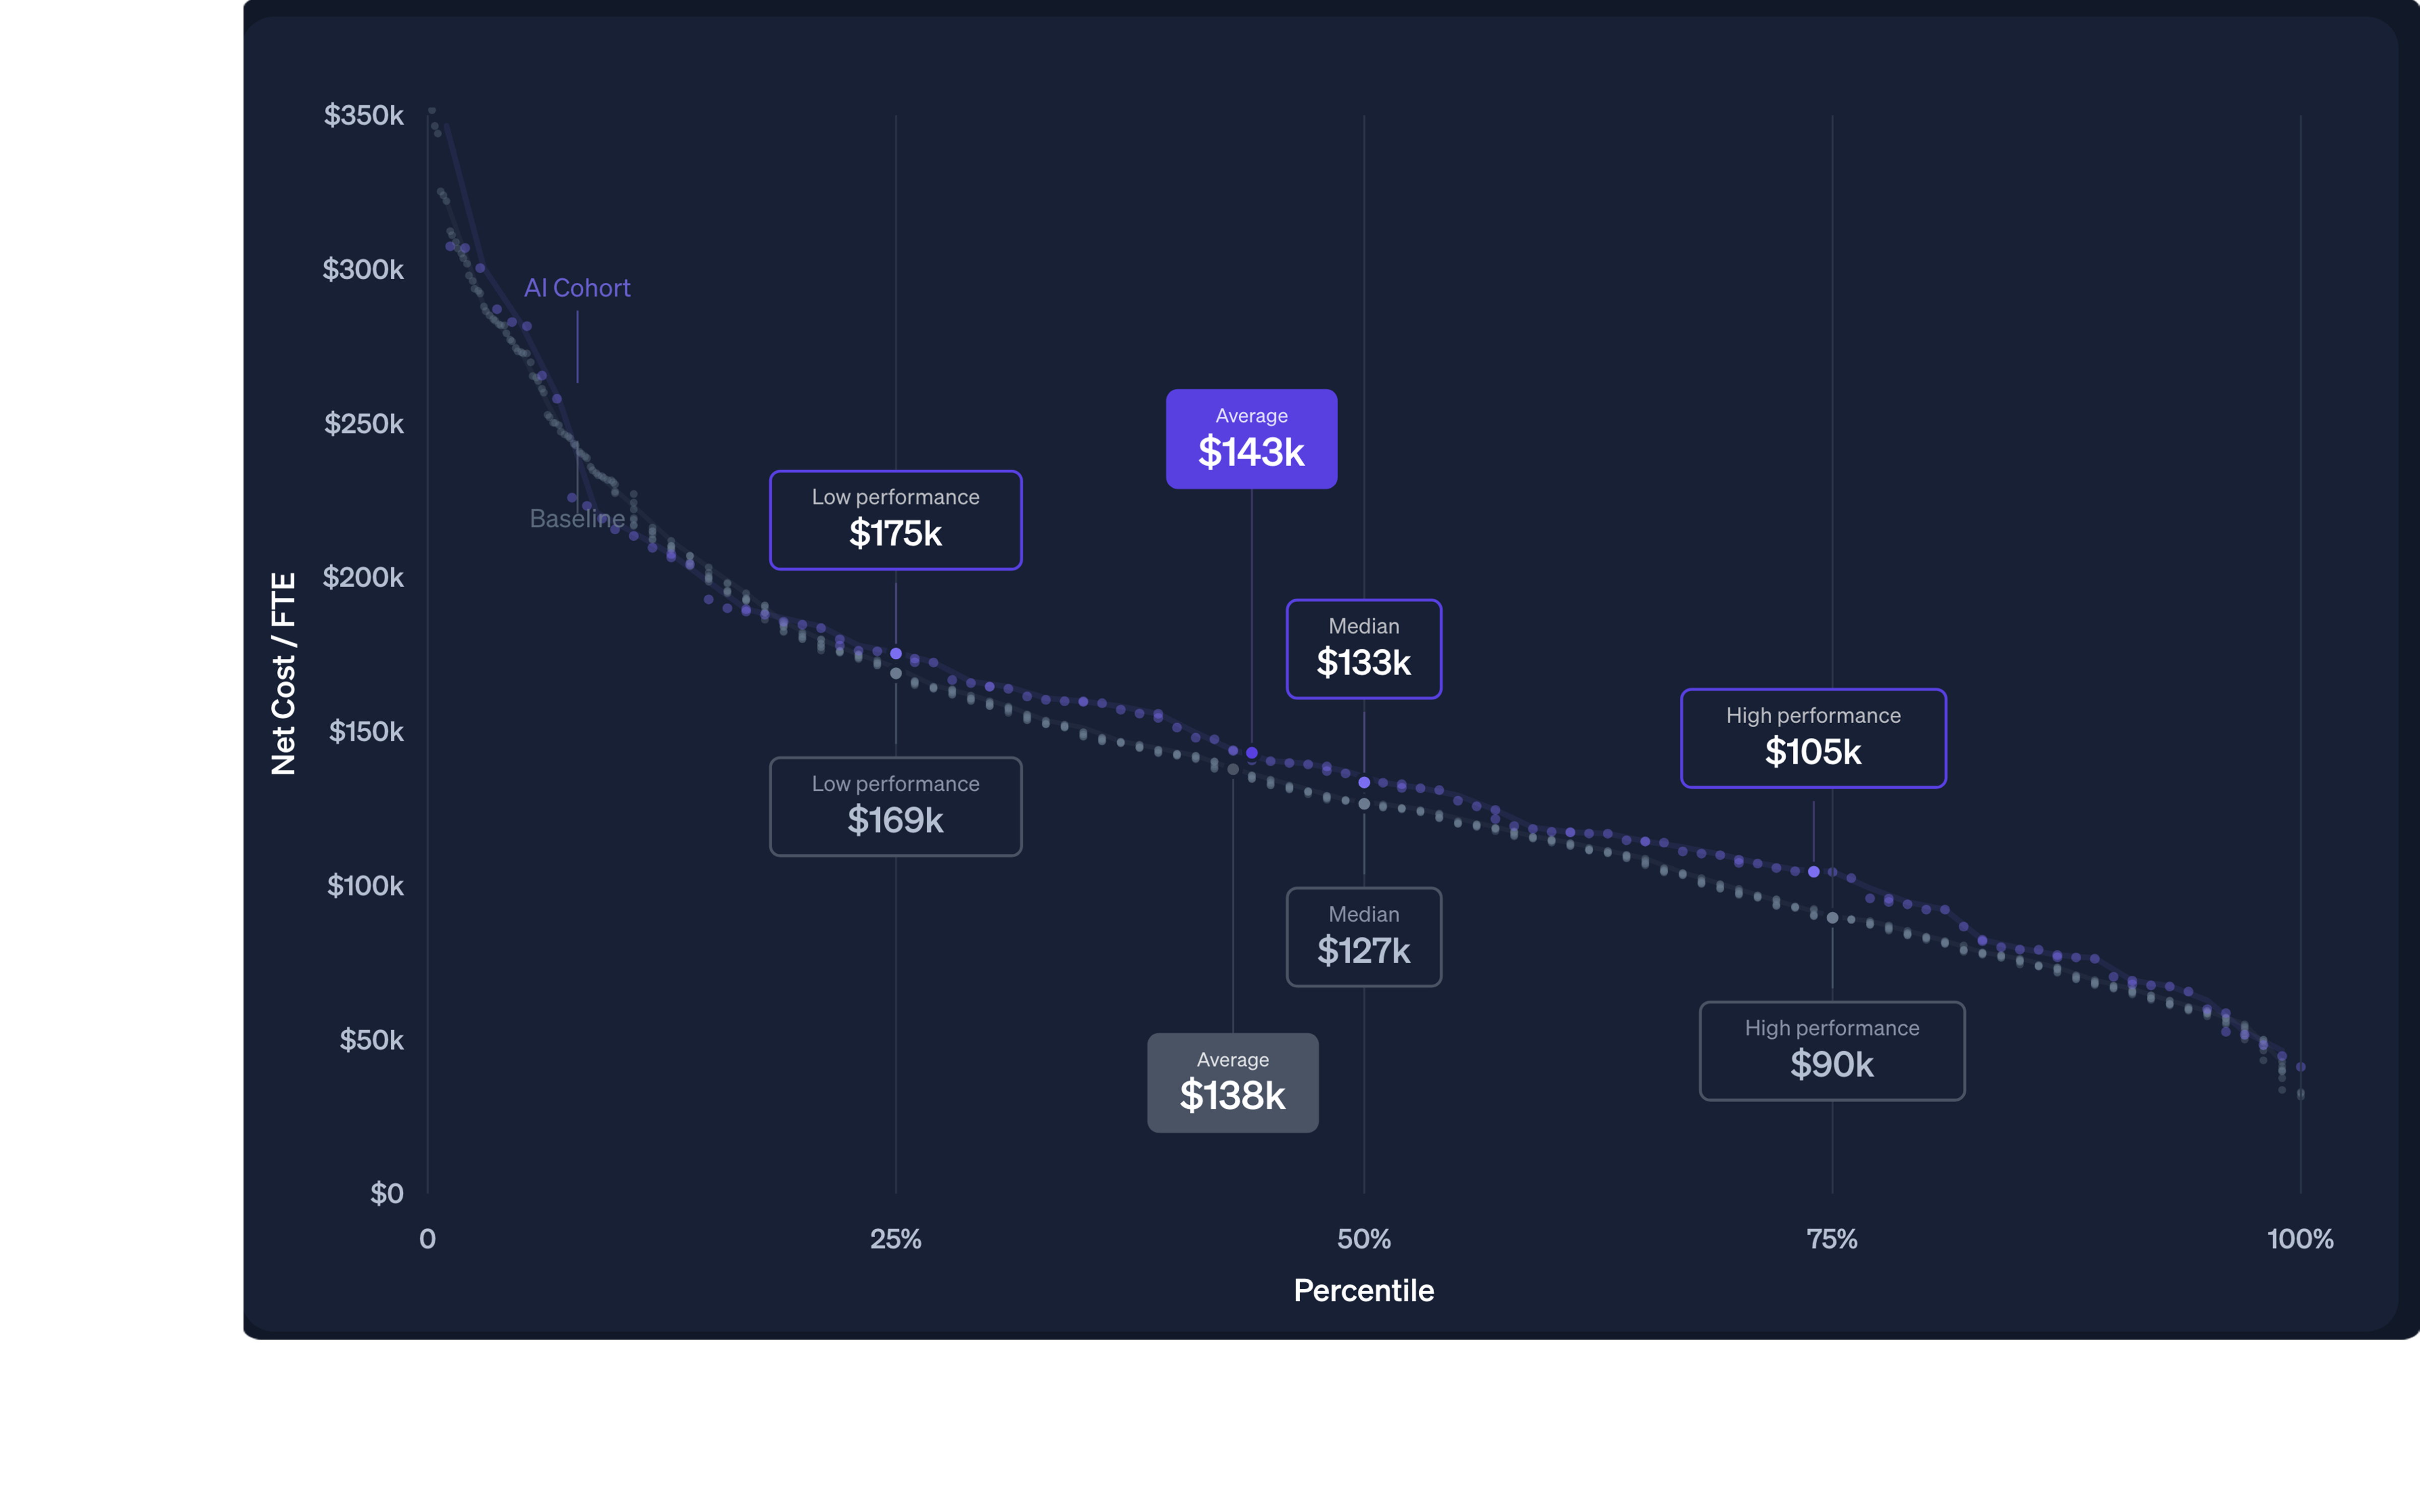
That $90K gap reflects fundamentally different team structures and overhead models. High-performing firms are not just lean. They have built overhead models that scale without adding proportional headcount, and they are using AI tools to do more with the staff they have.
AI-adopting firms in this dataset spend $143K per employee on average versus $138K at baseline, a 3.9% premium, but they net $15K more margin per employee after accounting for higher costs. That is a 3:1 return on the incremental spend.
What AI Is Doing to Engineering Firm Costs
For the first time, the 2026 report identifies engineering firms investing in AI and compares their cost performance. For engineering firms, the AI story on cost is nuanced.
AI firms spend more per employee, not less. But where the advantage shows up is in what they get for that spend. Specifically, AI firms run 14% higher utilization on operations staff, the senior engineers and project managers who previously spent significant time on non-billable coordination and admin. That time is now going to billable work instead.
The back-office compression effect is also real: AI firms pay 11% less for back-office roles compared to baseline firms. AI tools are reducing the need for senior administrative talent, and that saving flows directly into margin.
For engineering firms, whose cost structure is already weighted heavily toward employees, these efficiency gains compound more meaningfully than they do at firms with significant consultant spend. When your labor is your primary cost, anything that makes that labor more productive has outsized impact.

What to Watch in Your Own Numbers
For engineering firms specifically, the metrics worth tracking closely are your employee cost as a share of total cost, your revenue per FTE relative to your cost per FTE, and whether your consultant spend is growing as a share of costs without a matching revenue increase.
That last one matters most. For an engineering firm, rising consultant spend is a signal worth investigating. Unlike at an architecture firm where it is a normal part of the delivery model, consultant spend growth at an engineering firm can mean you are subbing out work your team should be doing in-house, billing less while paying someone else the margin.
The 2026 report offers five specific actions for improving cost per FTE:
- Challenge a low cost per FTE below $95K because it often means underinvesting in the tools and talent that drive revenue, and it shows up in performance over time
- Match your consultant spend to your delivery model because a rising consultant share without matching revenue growth means you are subbing out unbilled scope
- Audit senior staff assignments above $185K per FTE to confirm they are on projects that justify their rate
- Put your margin surplus into tools or retention since revenue grew 5.4% while costs grew just 0.5% in 2026, meaning firms running well have real margin to deploy right now
- Track cost at the project level, not just firm-wide because that is where overspend hides, and firm-wide averages can mask individual projects quietly dragging down overall efficiency
How Does Your Firm Compare?
High-performing A&E firms in this dataset run $90K to $105K in net cost per FTE. The average is $138K to $143K. If you are above $175K, you are in the bottom quartile, worth auditing not necessarily to cut, but to understand whether that spend is driving proportional revenue.
For engineering firms, the benchmark that matters most is not just the total cost number. It is the ratio of what you are spending on your people versus what they are generating in billable revenue. That is where your competitive advantage either compounds or erodes.


