.webp)
Big news: Today we released our 2026 Architecture & Engineering Business Benchmarks Report—and it’s free!
Every architect & engineer wants to know how salaries and business metrics compare across firms, but benchmarks can be costly to access (if not impossible). And with AI reshaping how firms operate, the stakes for knowing your numbers have never been higher.
We wanted to solve this for you.
Starting now, you can compare your A&E firm versus others for free!
Unlike survey-based benchmarks, we anonymized data from Monograph, a firm management platform used by 16,000+ architects & engineers to track projects, hours, and billing. Every number in this report comes from that data, including, for the first time, how AI-adopting firms are pulling ahead.
Most A&E firms are small! 90% of architecture and engineering (A&E) firms are between 1–50 employees, and yet they often lack the data they need to succeed or to know whether AI is actually worth the investment.
This new report fills this gap, giving small-midsize firms a clear view of how they compare to peers, where AI is changing the math, and what actionable steps you can take to improve.
It's time for radical transparency
Tracking project success is extremely painful without the right data. That's why we created Monograph.
And now, with Monograph's 2026 Benchmarks Report, your A&E firm can see exactly where you stand compared to others, so you can better prioritize.
This year's report introduces brand-new sections on AI adoption, seasonality, and collaboration, alongside the core metrics you've come to rely on.
The new averages we uncovered might surprise you
- Revenue: $210K/year per employee (AI cohort) vs. $190K baseline
- Cost: $143K/year per employee (AI cohort) vs. $138K baseline
- Utilization: 81% average across all firms
- Realization: 100% average at AI cohort firms
- Cash flow: 34-day average time-to-payment; top performers collect in 22 days
- Salary: Ranges from $65K (back-office, AI firms) to $132K (Principal)
The biggest finding: AI is changing the math
For the first time, we identified firms investing in AI tools and compared their performance where the data shows a meaningful difference. The results are striking.
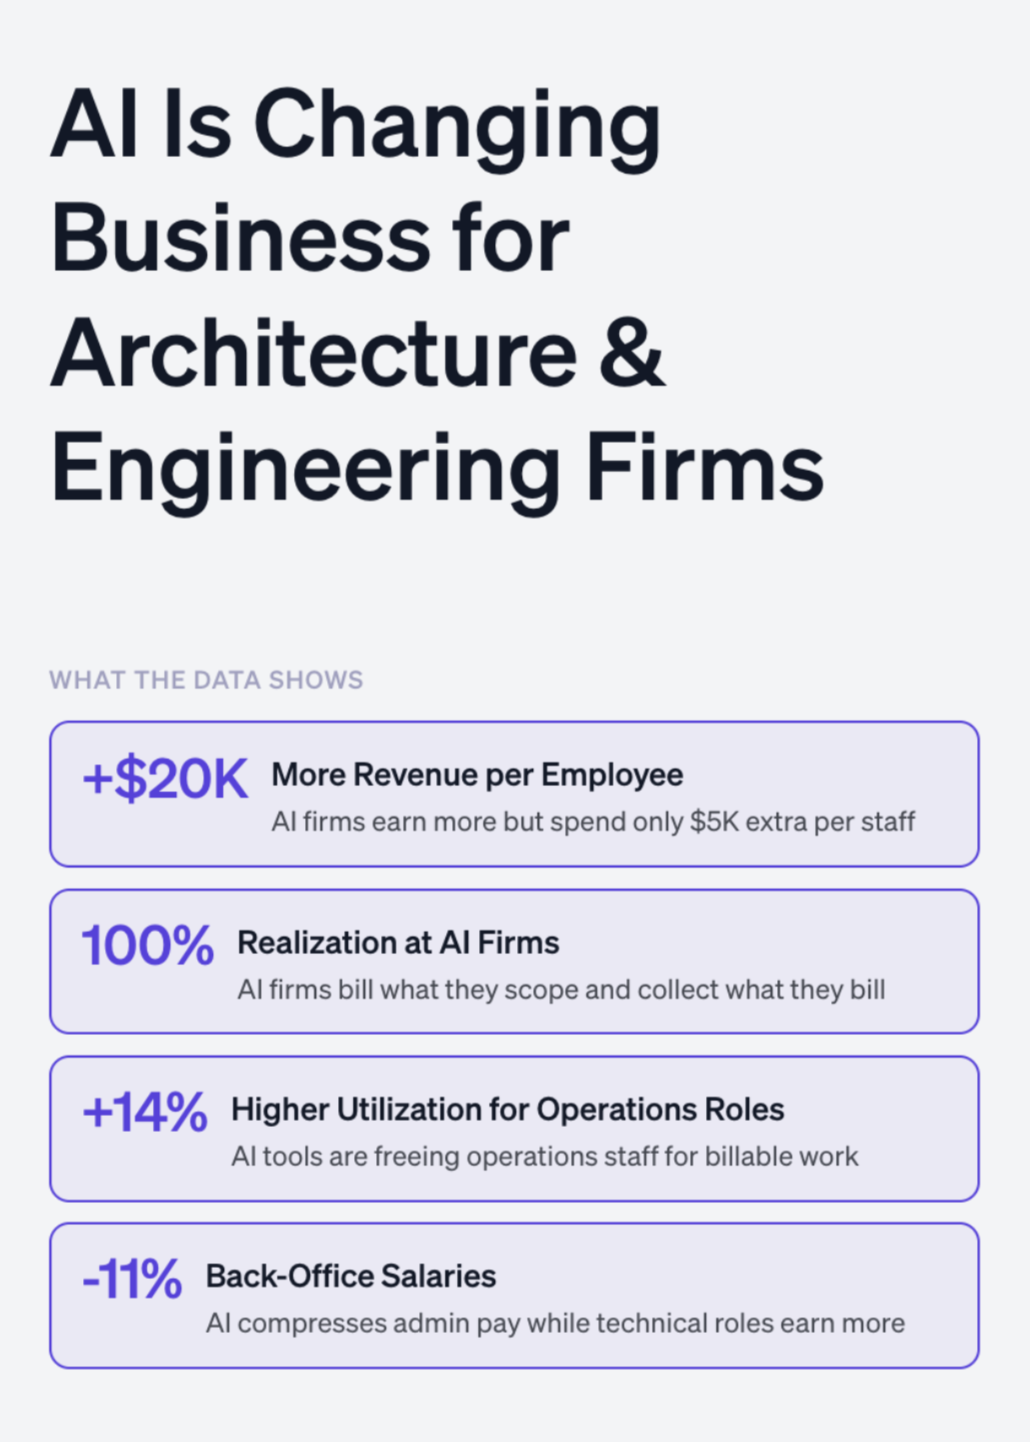
Top firms using AI generate $120K+ more per employee than low-performing firms without it—a gap that's up 30% from last year. AI firms spend $5K more per employee but earn $20K more, a 4-to-1 return that shows up in 14% higher operations utilization, 9-11% lower back-office salaries, and 4% higher realization.
Where are you high vs. low?
The report covers six core benchmarks, Revenue, Cost, Salary, Utilization, Realization, and Cash Flow, plus new AI adoption data, broken down by high vs. low performers across 660–856 A&E firms per metric.
Top firms generate nearly $98K more revenue per employee than bottom quartile firms. That's almost a full salary per employee in unrealized revenue sitting on the table.
The report's biggest wake-up call
Many architects and engineers expect earnings to rise with experience, but salary growth from Designer to Principal is surprisingly compressed, just a $56K spread across the entire career ladder. Revenue grew 3x faster than pay last year, meaning firms are capturing more value without passing it on.
That gap won't last. The firms that close it proactively will win the talent war.
Timing matters more than you think
New this year: seasonality data showing that May and October are the strongest billing months, running 10–14% above average. Q1 runs consistently cold, with January through April all below average. Planning your business development and capacity around these patterns is one of the fastest levers you have.
Get the ultimate checklist on how to improve
With the benchmarks in hand, you can use Monograph's included checklist to improve all six key metrics. Success starts with identifying the right issue from pricing, staffing, cash flow, to realization, and acting before the market forces your hand.
Too often, firms wait too long to check in on their metrics because the process is inefficient and disrupts project work. The 2026 report makes that easier than ever.
Here's the bottom line
Most A&E firms don't actually know their own numbers. If it takes you more than 5 minutes to see where you stand, you're flying blind.
Monograph helps you know your numbers, and the benchmark report shows you everyone else's.
Download the 2026 benchmark report for free at monograph.com/benchmark
.png)