Every New Project Is a Scheduling Decision
For operations leaders and principals at architecture and engineering firms, winning work is only half the challenge. The other half is knowing whether your team can actually deliver it — without burning out, over-allocating, or hiring too late.
Most firms answer that question after they've already committed. You win the project, then figure out staffing. Hiring happens reactively, over-allocation builds before anyone notices, and start dates get set without knowing whether your team has capacity. The tools to connect future work to current staffing simply haven't existed for project-based firms.
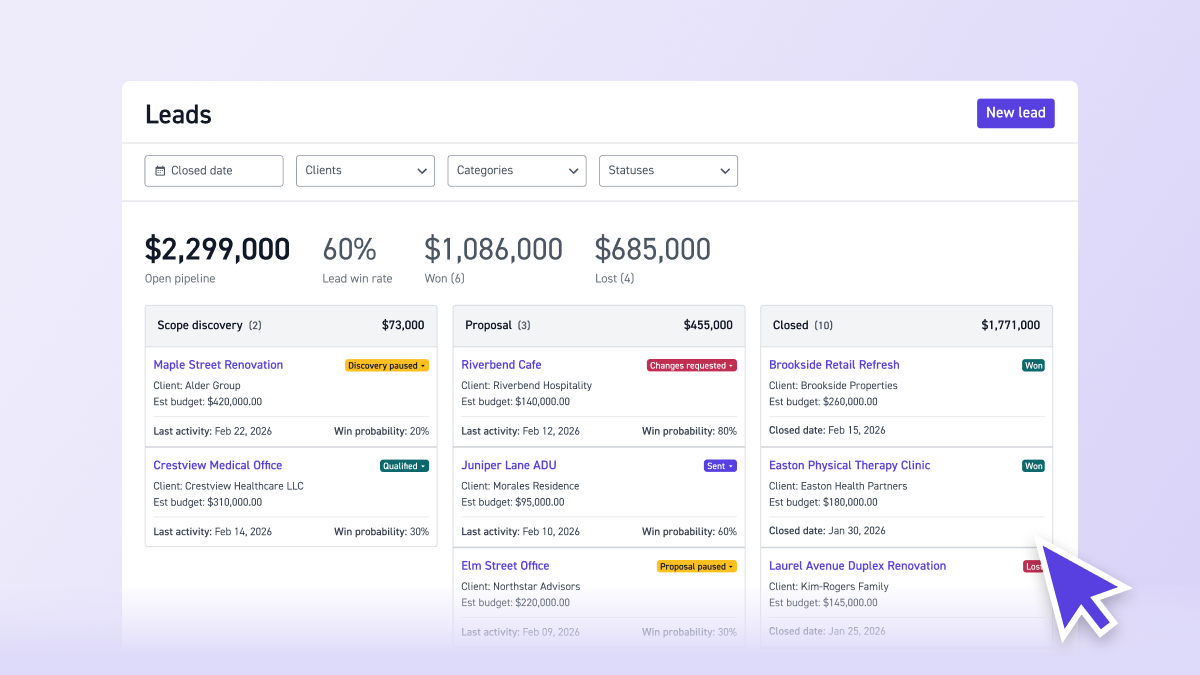
The Leads Capacity Report shows how your pipeline of leads affects your team's future workload — role by role, month by month. Select which leads to include, adjust start dates, and see where the crunch hits before you commit. Balanced teams, fewer fire drills, and growth that's intentional instead of reactive.
.png)
"Pipeline has really given us a clear view of staffing our opportunities as well as our retention rate for those opportunities. It's been a great tool and given us really valuable insight into our business."
— Andrew Lyon, Principal, Studio Lyon Szot
Here's a closer look at why it matters and how it works.
How Blind Staffing Decisions Hurt Your Firm
Without a way to forecast staffing from your leads, every new project win is a surprise to your operations plan. You're making commitments without knowing whether your team can absorb the work.
What happens when you can't forecast capacity from leads:
- You commit to work you can't staff. You win a project and then discover you don't have enough people in the right roles. You're either over-allocating existing team members or scrambling to hire.
- Hiring is reactive, not planned. You hire after you're overwhelmed, not before. By the time you realize you need a senior designer or a project manager, you're already behind and the role takes weeks to fill.
- You can't see which roles are the bottleneck. Maybe you have plenty of junior staff, but your project managers are maxed out. Without a role-level breakdown, the real constraint stays hidden behind a total headcount number.
- You can't compare scenarios. What happens if you win leads A and B but not C? What if a project starts two months later? Without a way to model different combinations and timelines, you're guessing.
- Start dates get set without considering capacity. You tell a client "we can start in March" without knowing whether your team has hours available in March. Then March arrives and you're overbooked.
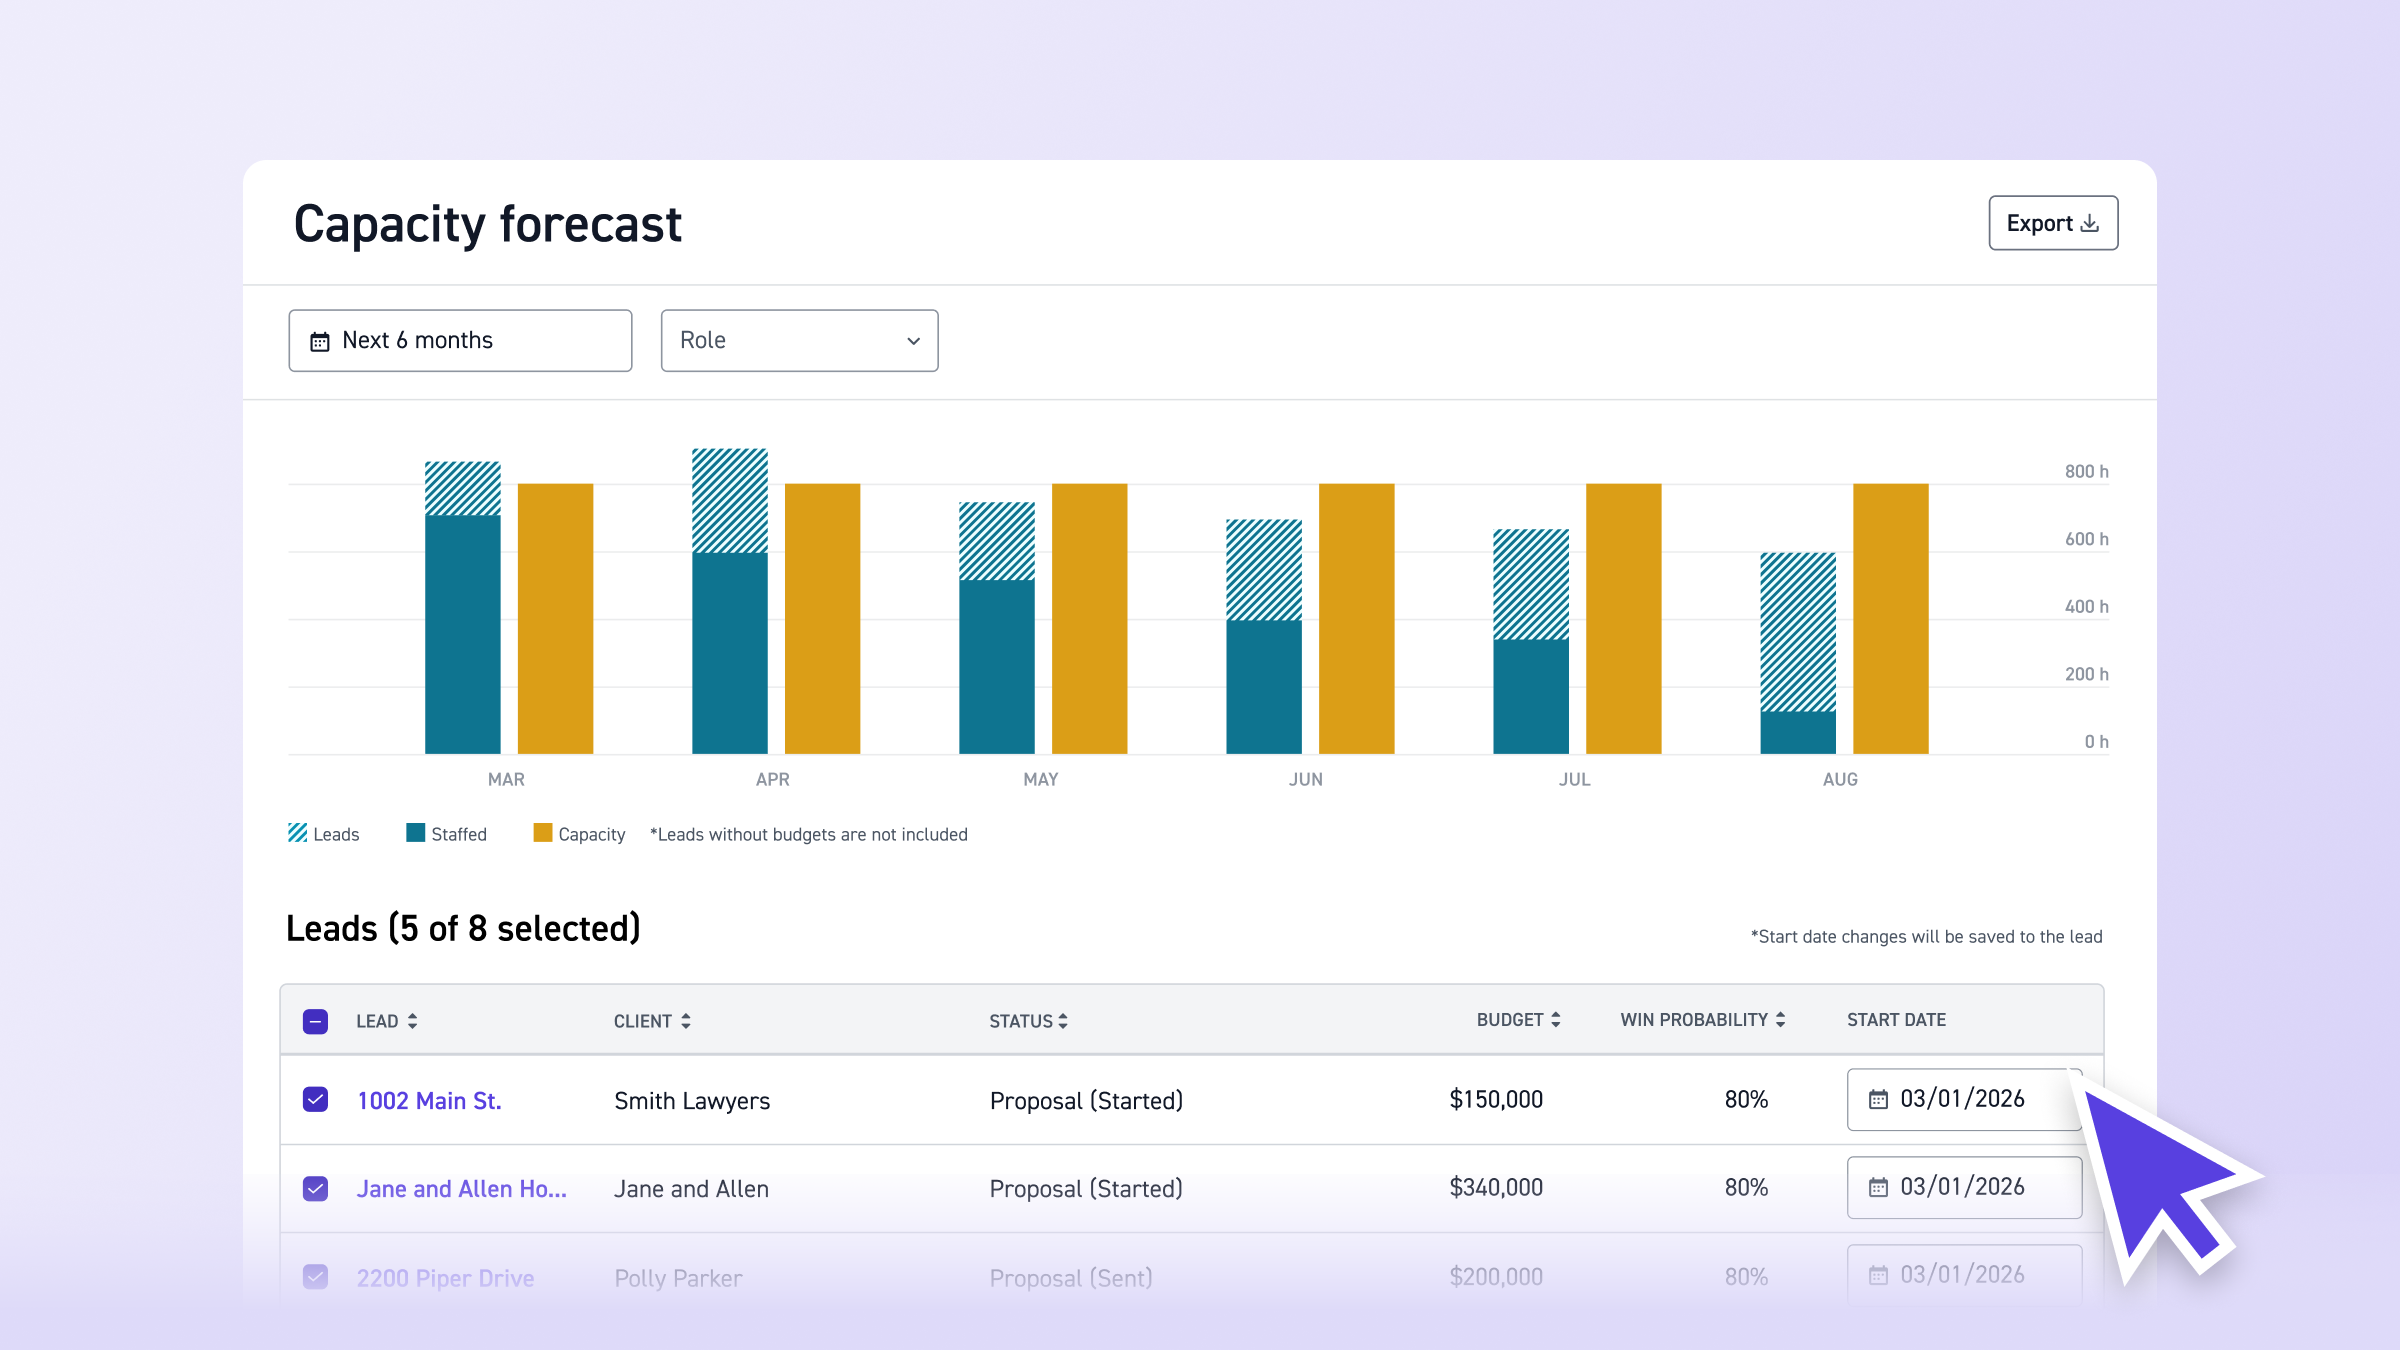
See Lead Hours Against Your Current Workload
Navigate to Pipeline > Capacity to open the Leads Capacity Report. The report shows a forecast chart at the top and a lead selection table below.
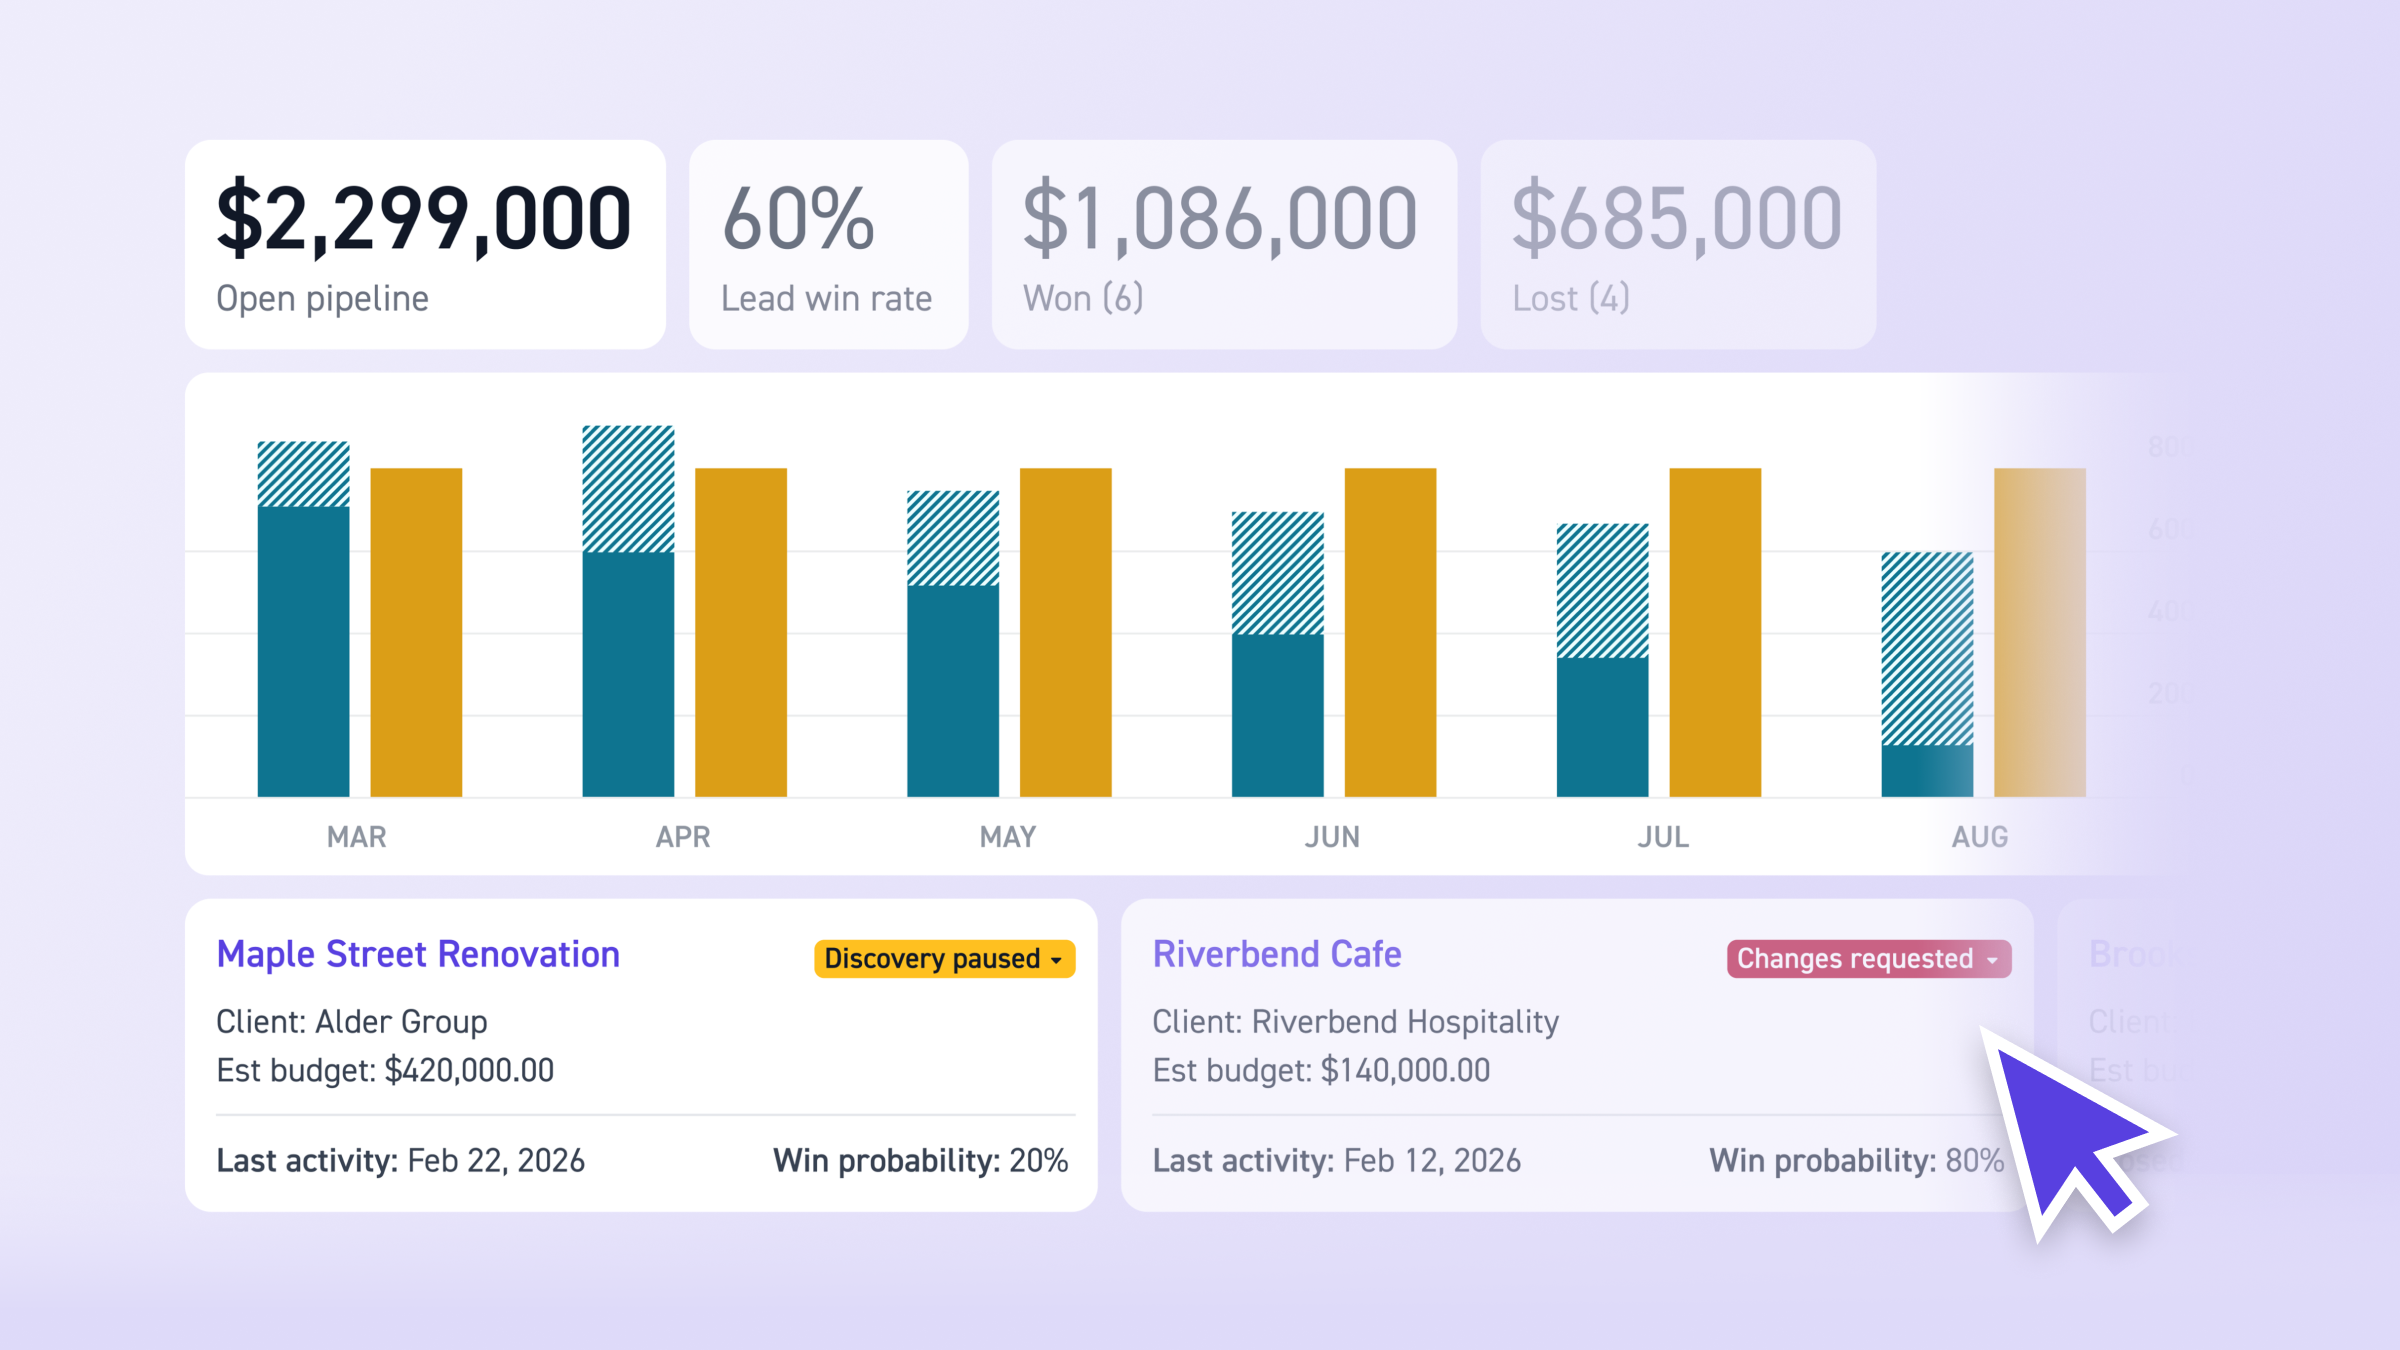
The chart displays three data points per month:
- Lead Hours: Hours needed if selected leads are won (weighted by win probability)
- Staffed Hours: Hours already committed to active projects in Staffing
- Capacity Hours: Total available hours based on each team member's compensation hours, minus time off and overhead
Select leads in the table and the chart updates to show their hours stacked on top of existing project staffing. When any role exceeds capacity in a given month, an over-capacity indicator appears. Hover over any month to see the role-level breakdown of hours.
Capacity is calculated from the compensation hours per week entered for each active employee. Lead hours come from the lead's budget, spread evenly across phase weeks. Win probability weights the forecast so you're seeing a realistic view of likely workload, not worst-case. For a full walkthrough, see Leads Capacity Report.
Filter by Role to Find the Bottleneck
Use the role filter to isolate specific roles across the forecast. This turns "we need more people" into "we need a senior designer starting in April" or "our project managers are at capacity through Q3."
The role-level breakdown shows exactly where you're over or under capacity in each month. You're not looking at total headcount. You're looking at whether the specific roles your leads need are available in the months they need them.
This is especially useful during BD check-ins. Instead of a general conversation about whether the firm can take on more work, you can point to specific months and roles where winning a lead creates a constraint, and where there's still room.
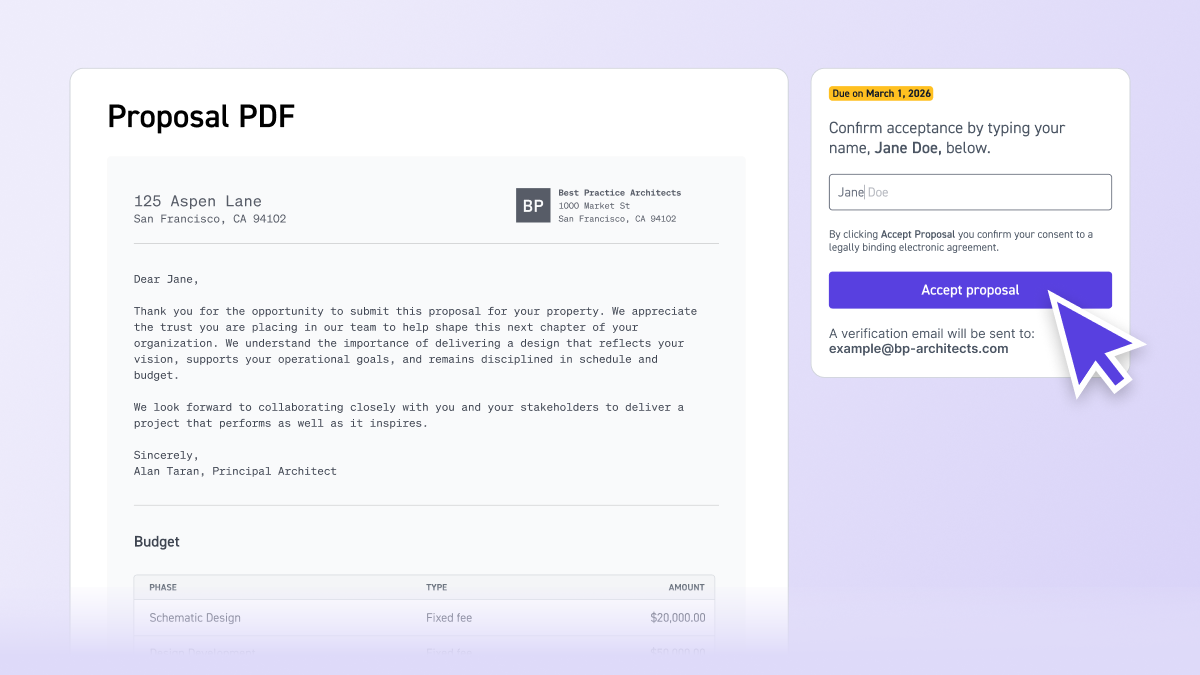
Model Scenarios and Adjust Timing
The lead selection table shows every open lead with a budget: lead name, client, status, budget, win probability, and start date. Leads are sorted by win probability (highest first) by default.
Check or uncheck leads to model different outcomes. See what happens if you win your top three leads vs. all of them. See what happens if you remove the one with the lowest probability. The chart updates in real time as you adjust the selection.
You can also edit start dates directly from the table. Shift a lead's start date forward to spread workload more evenly, or push it back to see if a later start resolves an over-capacity month. Changes to start dates here also update the lead's overview page, so your adjustments carry forward.
Export the data as a CSV (Month/Year, Lead Hours, Project Hours, Capacity Hours) if you need to share it outside Monograph.
Best Practices
- Add lead budgets early, even rough estimates. The report only includes leads with budgets. Getting an estimate in early means you can see staffing impact sooner, even if the numbers refine later.
- Review during BD check-ins. Use the report monthly to ground your pipeline discussions in staffing reality. It turns "can we take this on?" into a data-backed conversation.
- Use role filters to isolate bottlenecks. Don't just look at total capacity. Filter by the roles your leads actually need to see where the real constraints are.
- Adjust start dates to balance workload. If a month is over-capacity, try shifting a lead's start date from the table. Small timing changes can make the difference between a manageable month and a fire drill.
- Revisit win probabilities as conversations progress. The default probabilities (10% for new, 30% for qualified, 60% for sent) are starting points. Override them as you learn more about each opportunity so the forecast stays realistic.
Frequently Asked Questions
What do I need before the report works? Three things: current compensation hours for every active team member, a default role assigned to every active team member, and at least one open lead with a completed budget.
Which leads appear in the report? Only open leads with a budget. Leads without a budget have no hours to forecast. Closed Won and Closed Lost leads don't appear.
How is win probability used in the forecast? Each lead's hours are weighted by its win probability. A lead with a 60% probability contributes 60% of its budgeted hours to the forecast. You can override the default probability from the lead's overview page.
Can I adjust start dates from the report? Yes. Select a lead in the table and edit its start date directly. The change also updates the lead's overview page. Start dates must be in the future — past dates trigger an alert.
What happens if someone's compensation hours change mid-month? The report breaks the month into sections and calculates each part separately, so the capacity line stays accurate.
Can I export the data? Yes. Export as CSV with Month/Year, Lead Hours, Project Hours, and Capacity Hours.
From Pipeline to People
Capacity forecasting connects the work you're pursuing to the people who'll deliver it — and it's part of a broader system that also tracks leads, manages proposals, and projects revenue. Grow on purpose, not on guesswork.