You Can't Plan a Firm on Numbers You Don't Trust
Every major decision a firm makes — hiring, overhead, investment — depends on knowing what revenue looks like over the next six to twelve months. The forecast is the foundation.
But most architecture and engineering firms only forecast revenue from active projects. The leads in your pipeline — the ones you're actively pursuing — are invisible in the numbers. If your forecast ignores what's likely coming, leadership is planning on an incomplete picture.
Revenue Forecast shows lead revenue (weighted by win probability) alongside active project revenue in one view, month by month. Select which leads to include, adjust probabilities and timing, and see your firm's full revenue outlook — committed and potential — in one place.
.png)
Here's how it works and why it matters.
How Incomplete Revenue Forecasts Hurt Your Firm
When your revenue forecast only shows committed projects, every decision that depends on it is based on partial data. The cost isn't just imprecision. It's missed planning windows, misaligned hiring, and leadership making calls without seeing what's actually coming.
What happens when pipeline revenue is invisible:
- You're planning on half the picture. Your active projects tell you what's committed. But the leads you're likely to win will bring in real fees over real months. Without factoring them in, leadership can't see the full revenue trajectory.
- Hiring timing is off. If revenue is about to grow because three leads are likely to close in the next quarter, you need to staff for that now. But if the forecast doesn't show pipeline revenue, there's no signal to hire ahead.
- Revenue conversations are qualitative. When leadership asks "are we on track for the year?" the answer is gut feel, not data. There's no shared view that combines what's committed with what's likely.
- You can't model outcomes. What happens to revenue if you win your top three leads? What if one slips to next quarter? Without a way to toggle leads on and off and adjust timing, scenario planning is guesswork.
- Cash flow surprises catch you off guard. If you don't know when pipeline revenue is likely to arrive, you can't plan for payroll, overhead, or investments. Gaps surprise you. Surpluses go unplanned.
See Pipeline Revenue Alongside Active Projects
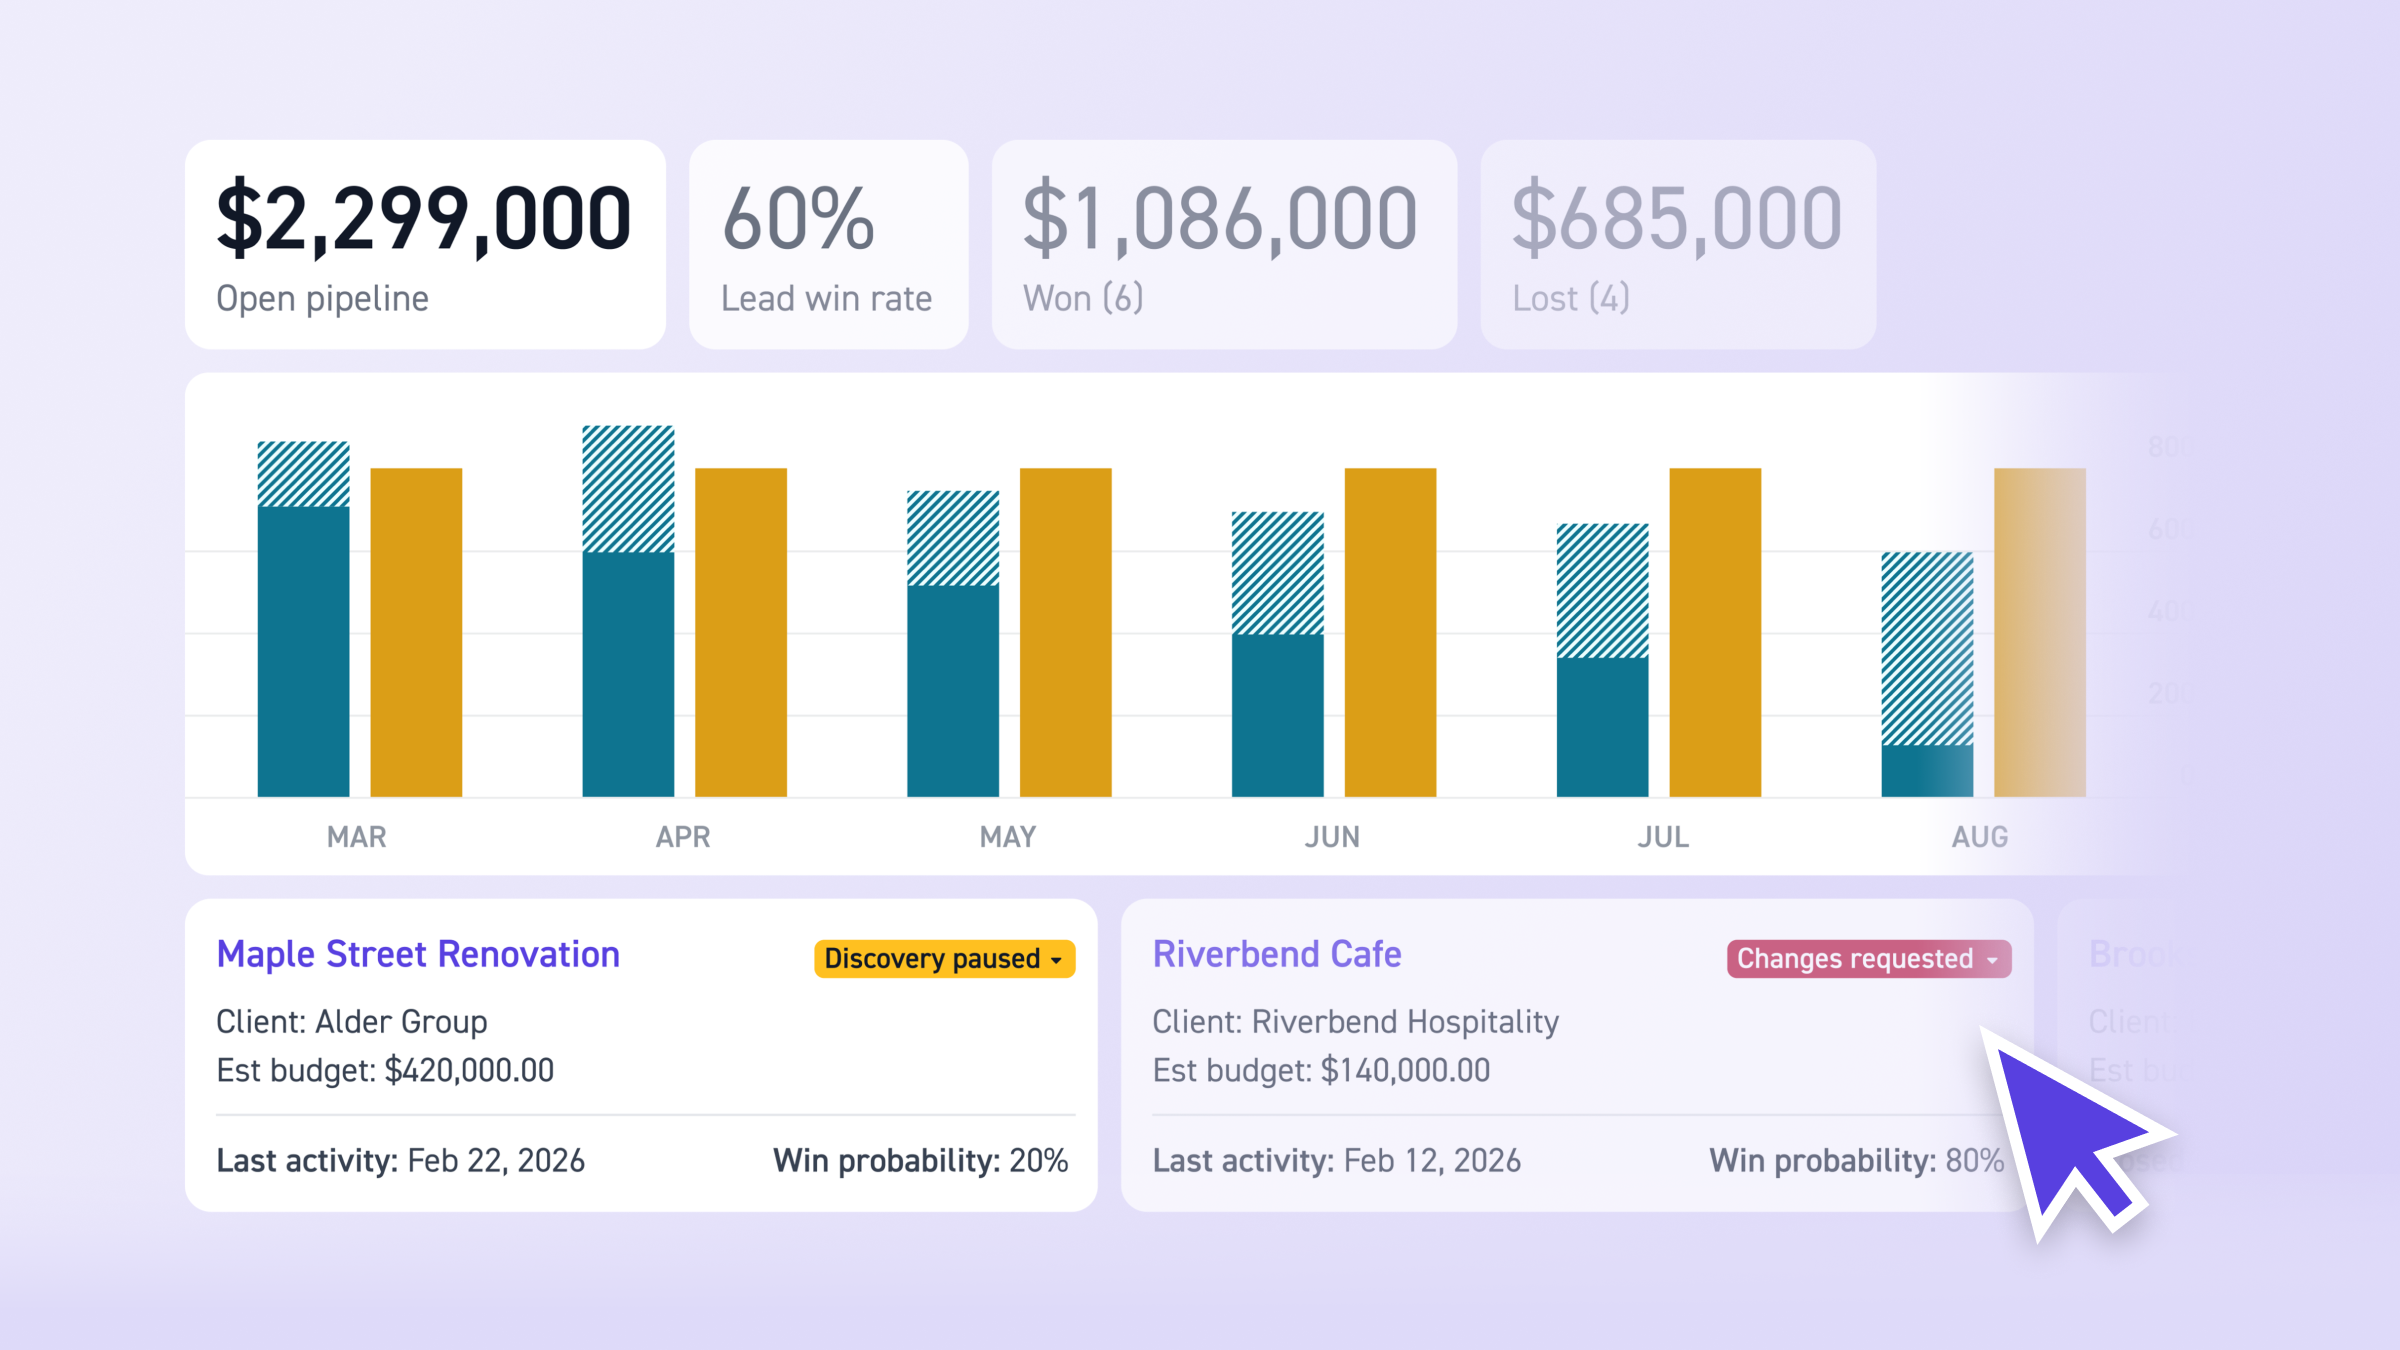
Navigate to Pipeline > Revenue to open the Leads Revenue Forecast Report. The chart shows two bars per month: Lead Revenue and Project Revenue.
Project Revenue shows committed revenue from active projects, distributed according to each project's billing expectations.
Lead Revenue is each lead's proposed budget multiplied by its win probability, spread across its phase timeline. A lead with a $200K budget and a 60% win probability contributes $120K to the forecast, distributed over the months its phases span. This gives you a realistic view of expected pipeline income, not an all-or-nothing guess.
Hover over any month to see the breakdown by individual lead or project. Use filters to narrow by time range, client, or category.
Together, these two bars show your firm's total revenue outlook: what's committed plus what's likely coming, viewed in fees rather than generic deal sizes. For a full walkthrough, see Leads Revenue Forecast Report.
Model Scenarios and Adjust Estimates
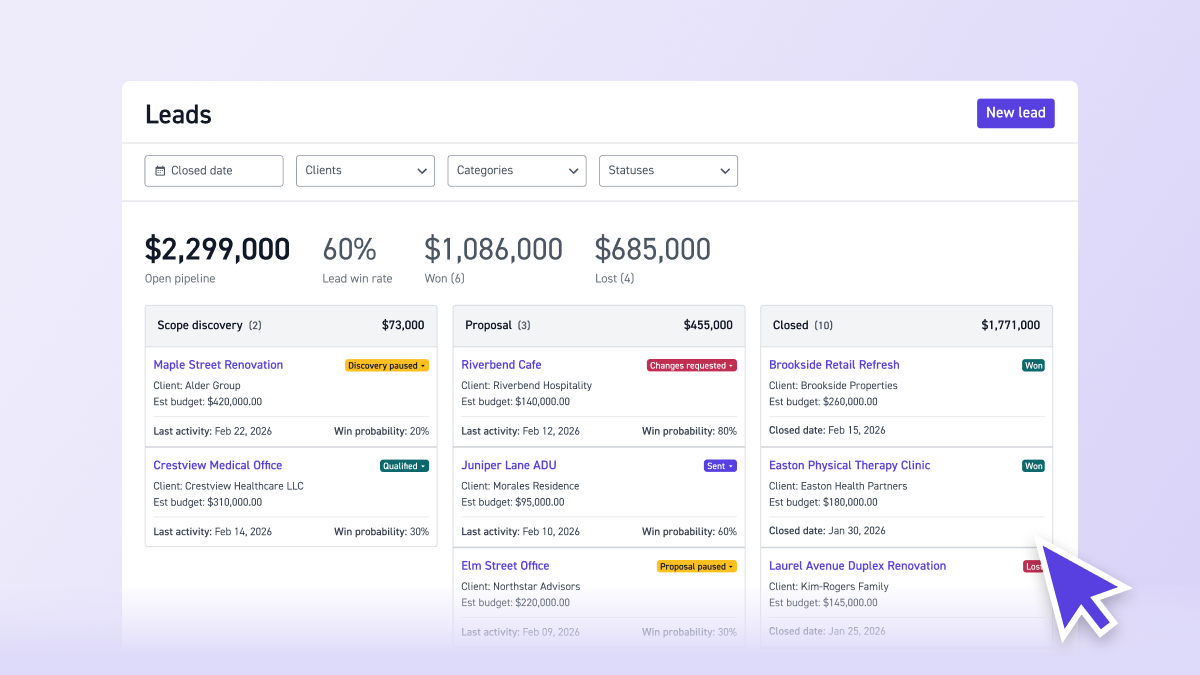
The lead selection table below the chart shows every open lead with a budget: lead name, client, status, revenue, suggested win percentage, manual win probability override, and start date.
Check or uncheck leads to model different outcomes. See what revenue looks like if you win your top three leads vs. all of them. Adjust win probabilities as you learn more about each opportunity. Shift start dates to see how timing changes affect the revenue curve. All changes update the chart in real time, and start date changes carry back to the lead's overview page.
Default win probabilities are based on lead status (10% for new, 30% for qualified, 40% for started, 60% for sent, 80% for changes requested). Override them as deals progress so the forecast stays realistic.
Export the data as a CSV (Month/Year, Lead Revenue, Project Revenue) to share with partners or use in board presentations.
Best Practices
- Add lead budgets early. Leads without budgets don't appear in the revenue forecast. Even a rough estimate gives you visibility into potential revenue sooner.
- Review monthly during BD and financial check-ins. Use the report to ground revenue discussions in data. It turns "I think we're on track" into a shared view of projected income.
- Update win probabilities as conversations progress. The defaults are starting points. Adjust them as deals move forward so the forecast stays realistic.
- Use filters to focus. Narrow by client or category to see revenue projections for specific segments of your pipeline.
- Model before you commit. Before taking on a new lead or adjusting a timeline, toggle it in the report to see how it affects your revenue curve.
Frequently Asked Questions
How is lead revenue calculated in the forecast? Each lead's proposed budget is multiplied by its win probability and spread evenly across the days in each phase. Consultant amounts are spread separately.
Do I need anything set up before the report works? Each lead needs a start date and a completed proposal budget. Leads without budgets or with past start dates aren't included. Closed and archived leads are excluded.
Can I adjust win probabilities and start dates from the report? Yes. Both are editable directly in the lead selection table. Changes to start dates also update the lead's overview page.
Can I export the forecast data? Yes. The report exports as a CSV with Month/Year, Lead Revenue, and Project Revenue.
Who can access the Leads Revenue Forecast Report? Admins or users with both "Manage Leads" and "Financial Reports" permissions.
From Pipeline to Financial Plan
Revenue forecasting connects your pipeline to your financial outlook — and it's part of a broader system that also tracks leads, manages proposals, and plans capacity. See future work clearly, staff with confidence, deliver profitably.