
Forecast revenue with confidence
Focus on the right leads, forecast revenue, and plan staff before work begins.
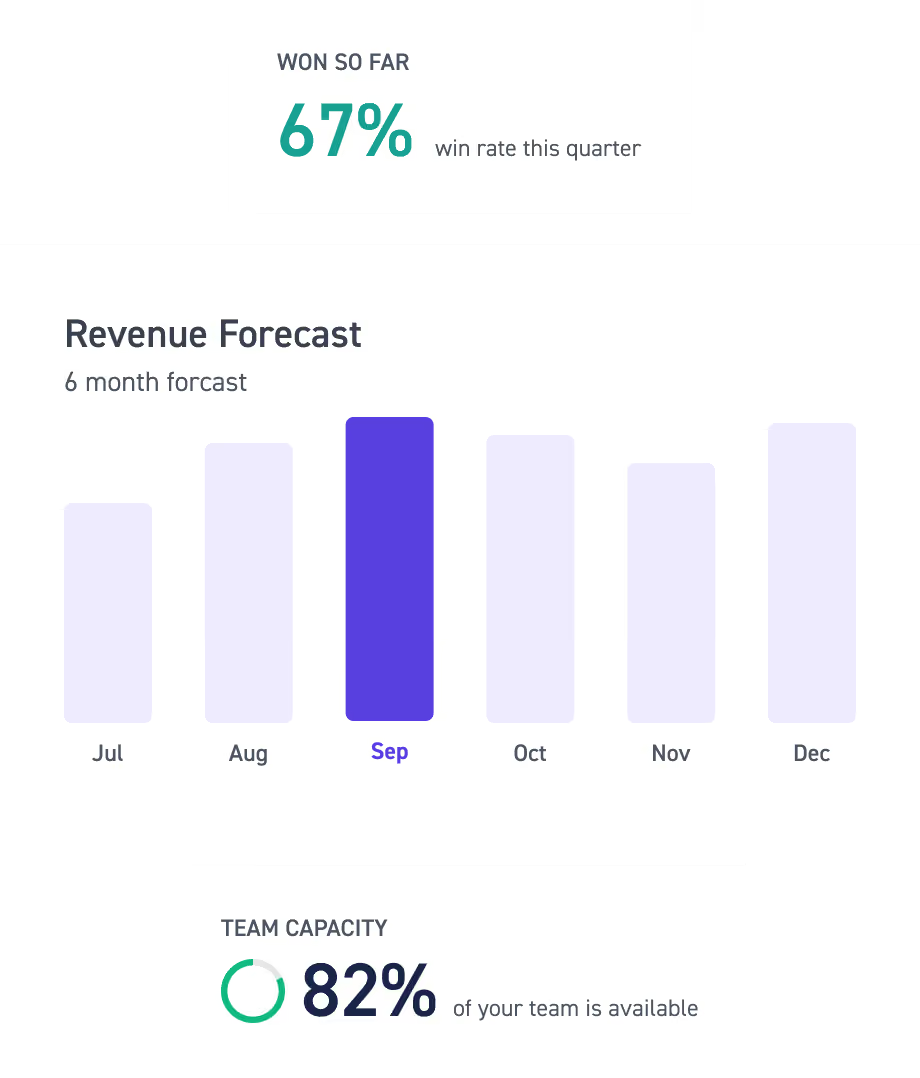
Clarify and quantify your firm’s future
See future work clearly so you can make smarter decisions about opportunities, revenue, and staffing.
“Pipeline has really given us a clear view of staffing our opportunities as well as our win rate. It’s been a great tool and given us really valuable insight into our business.”

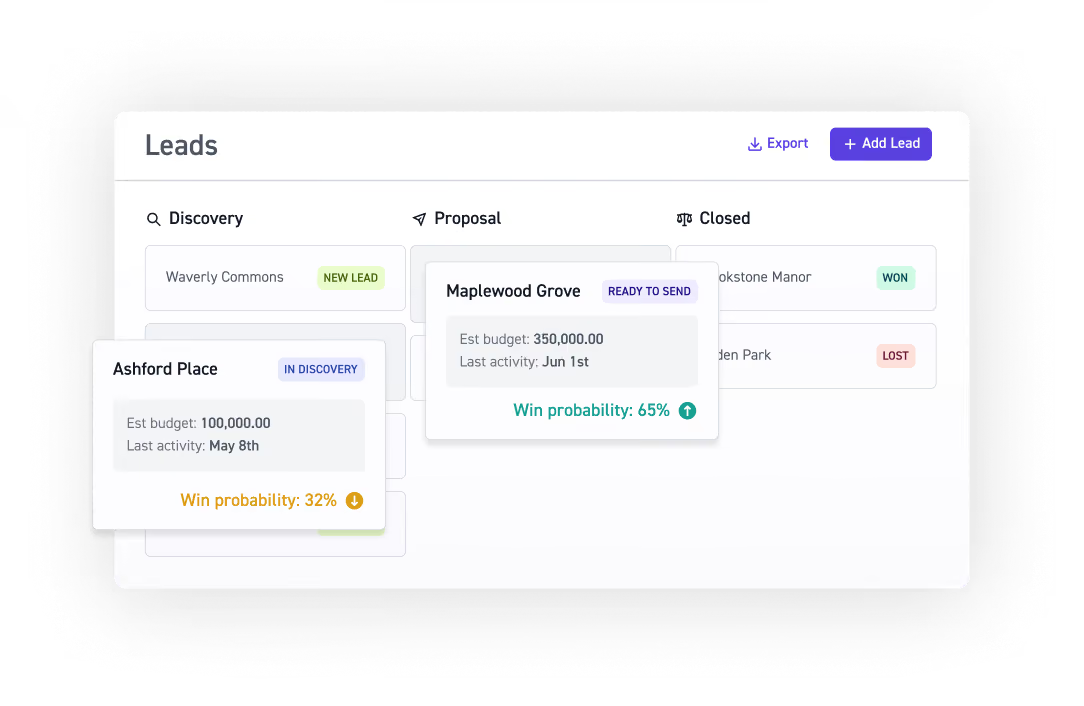
Analyze win rates
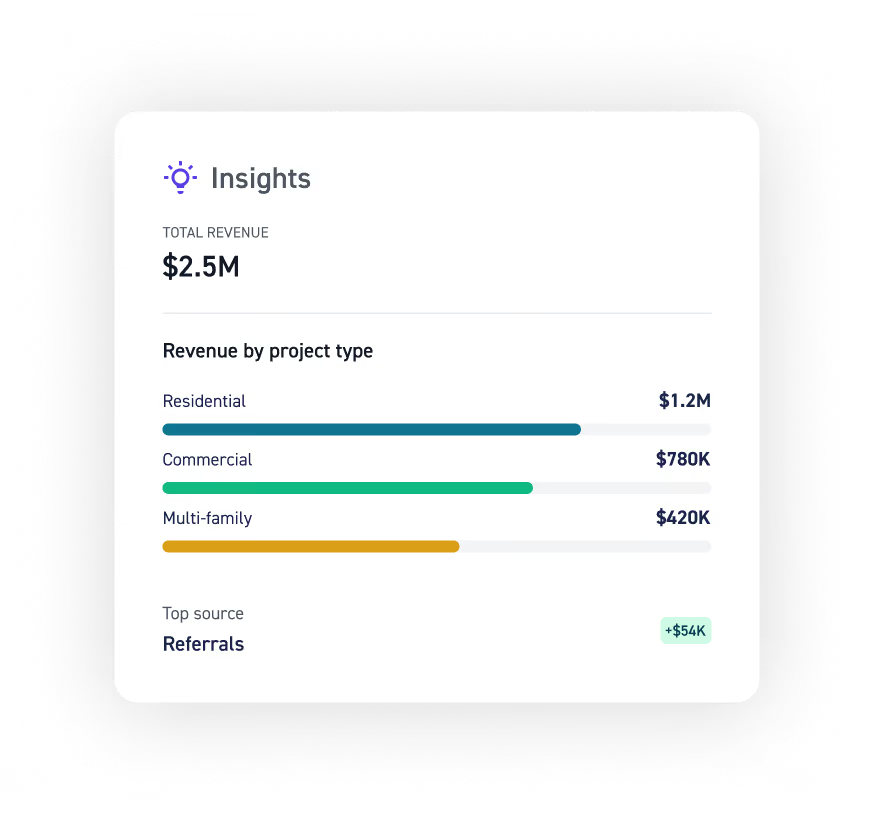
See historical win rates by source, stage, client, and project type. See exactly which pursuits your firm closes, and focus proposals where they pay off most.
Plan beyond the pipeline
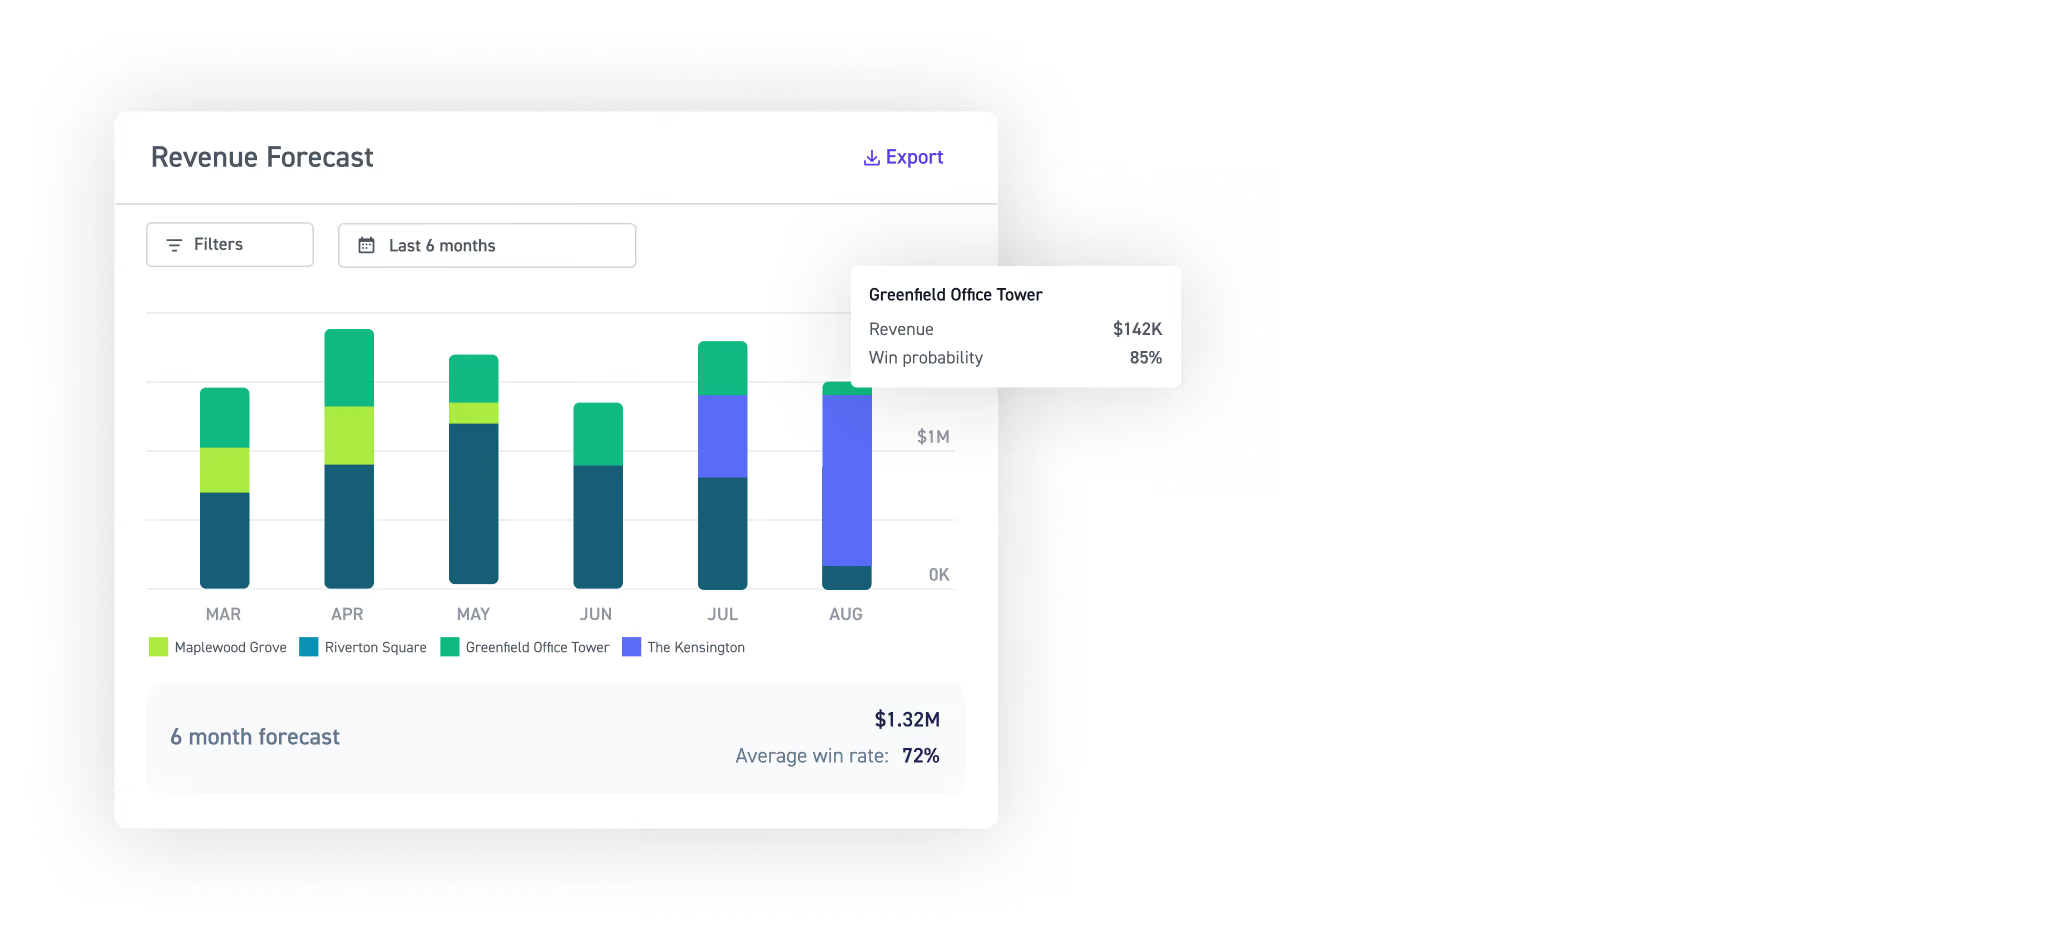
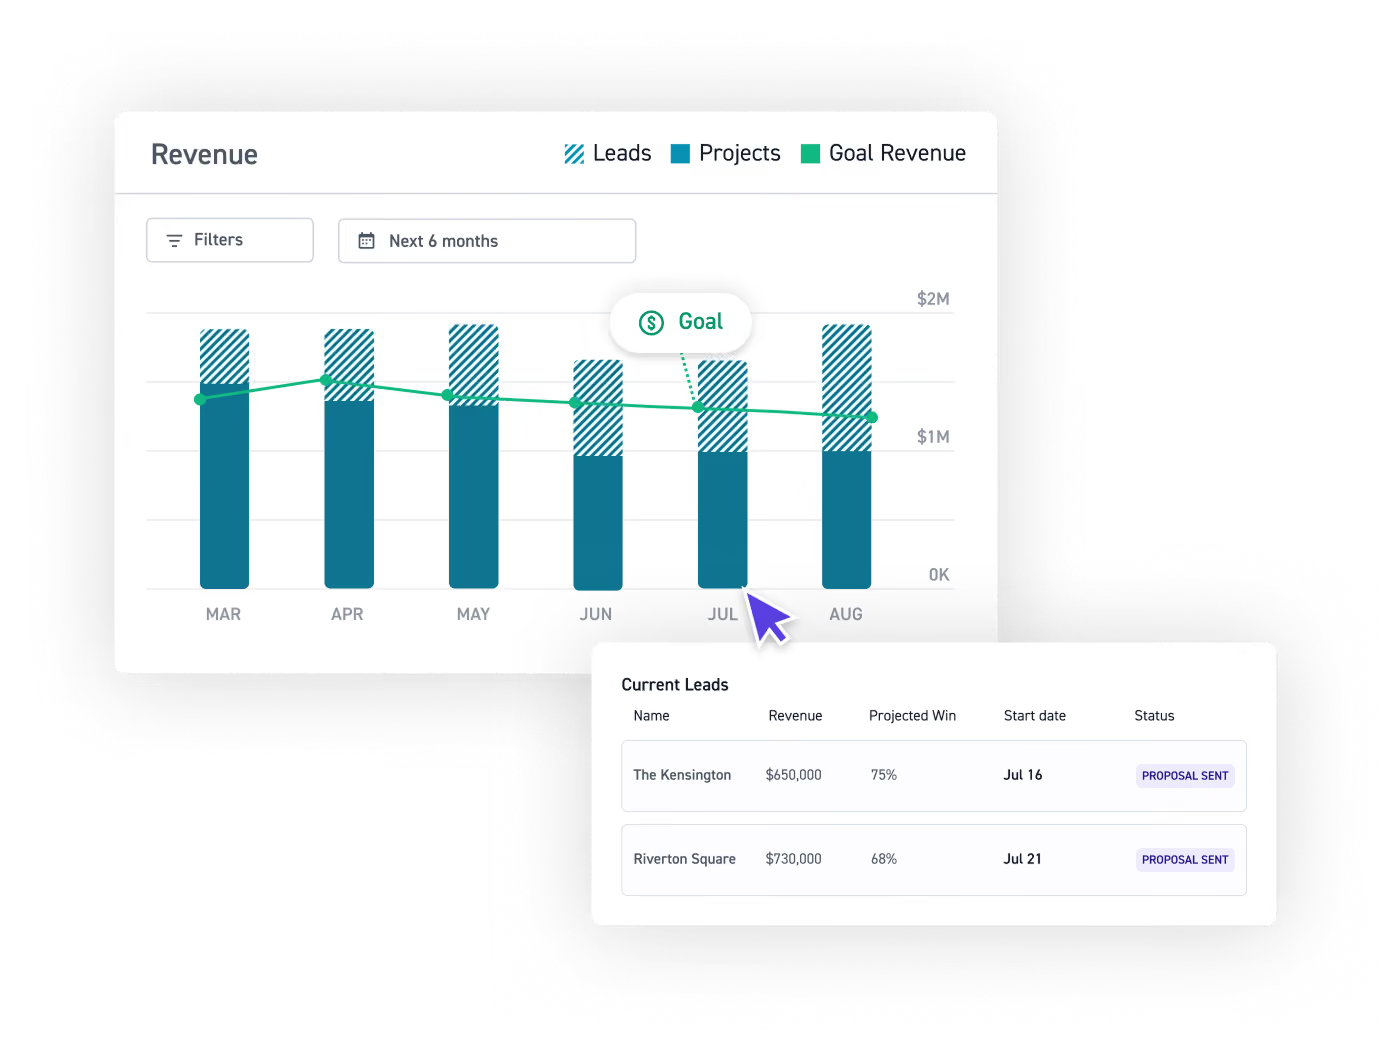
Combine weighted opportunities, active projects, and future revenue in one forecast to clearly understand what's ahead, not just what's in your pipeline.
Avoid understaffing and overstaffing
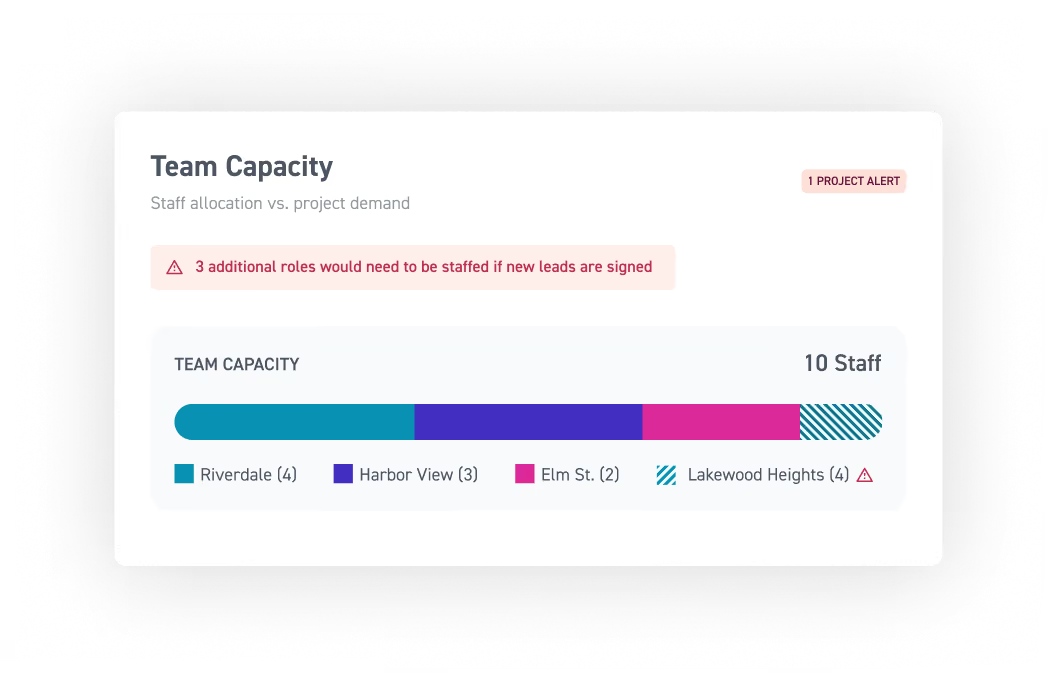
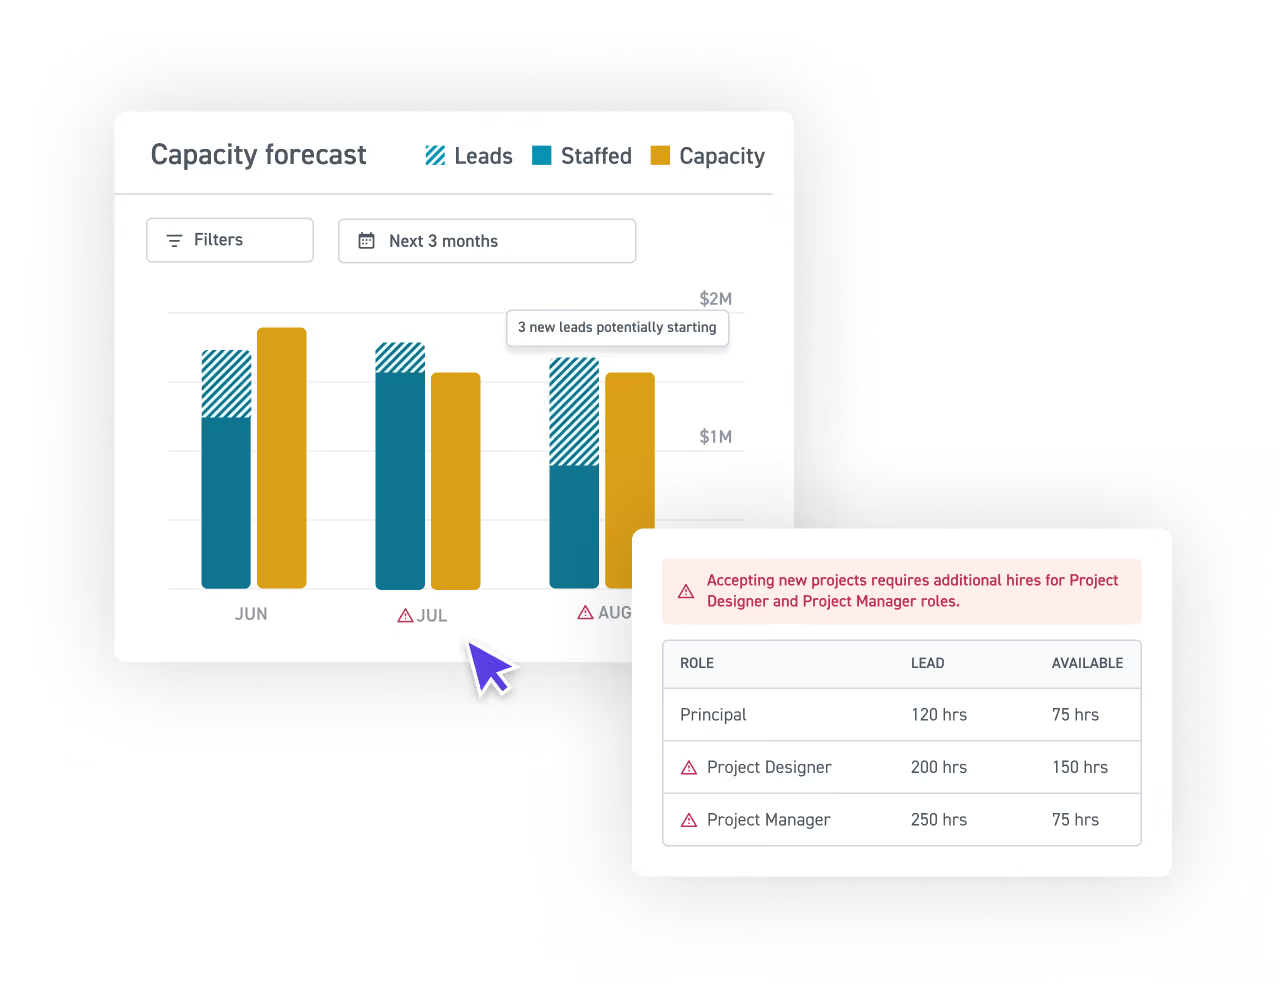
Compare staffing availability against pipeline and active project demand. Get insights on your capacity by asking: When can we start? Are we at capacity? Do we need to hire?
Forecasting to help firms plan ahead
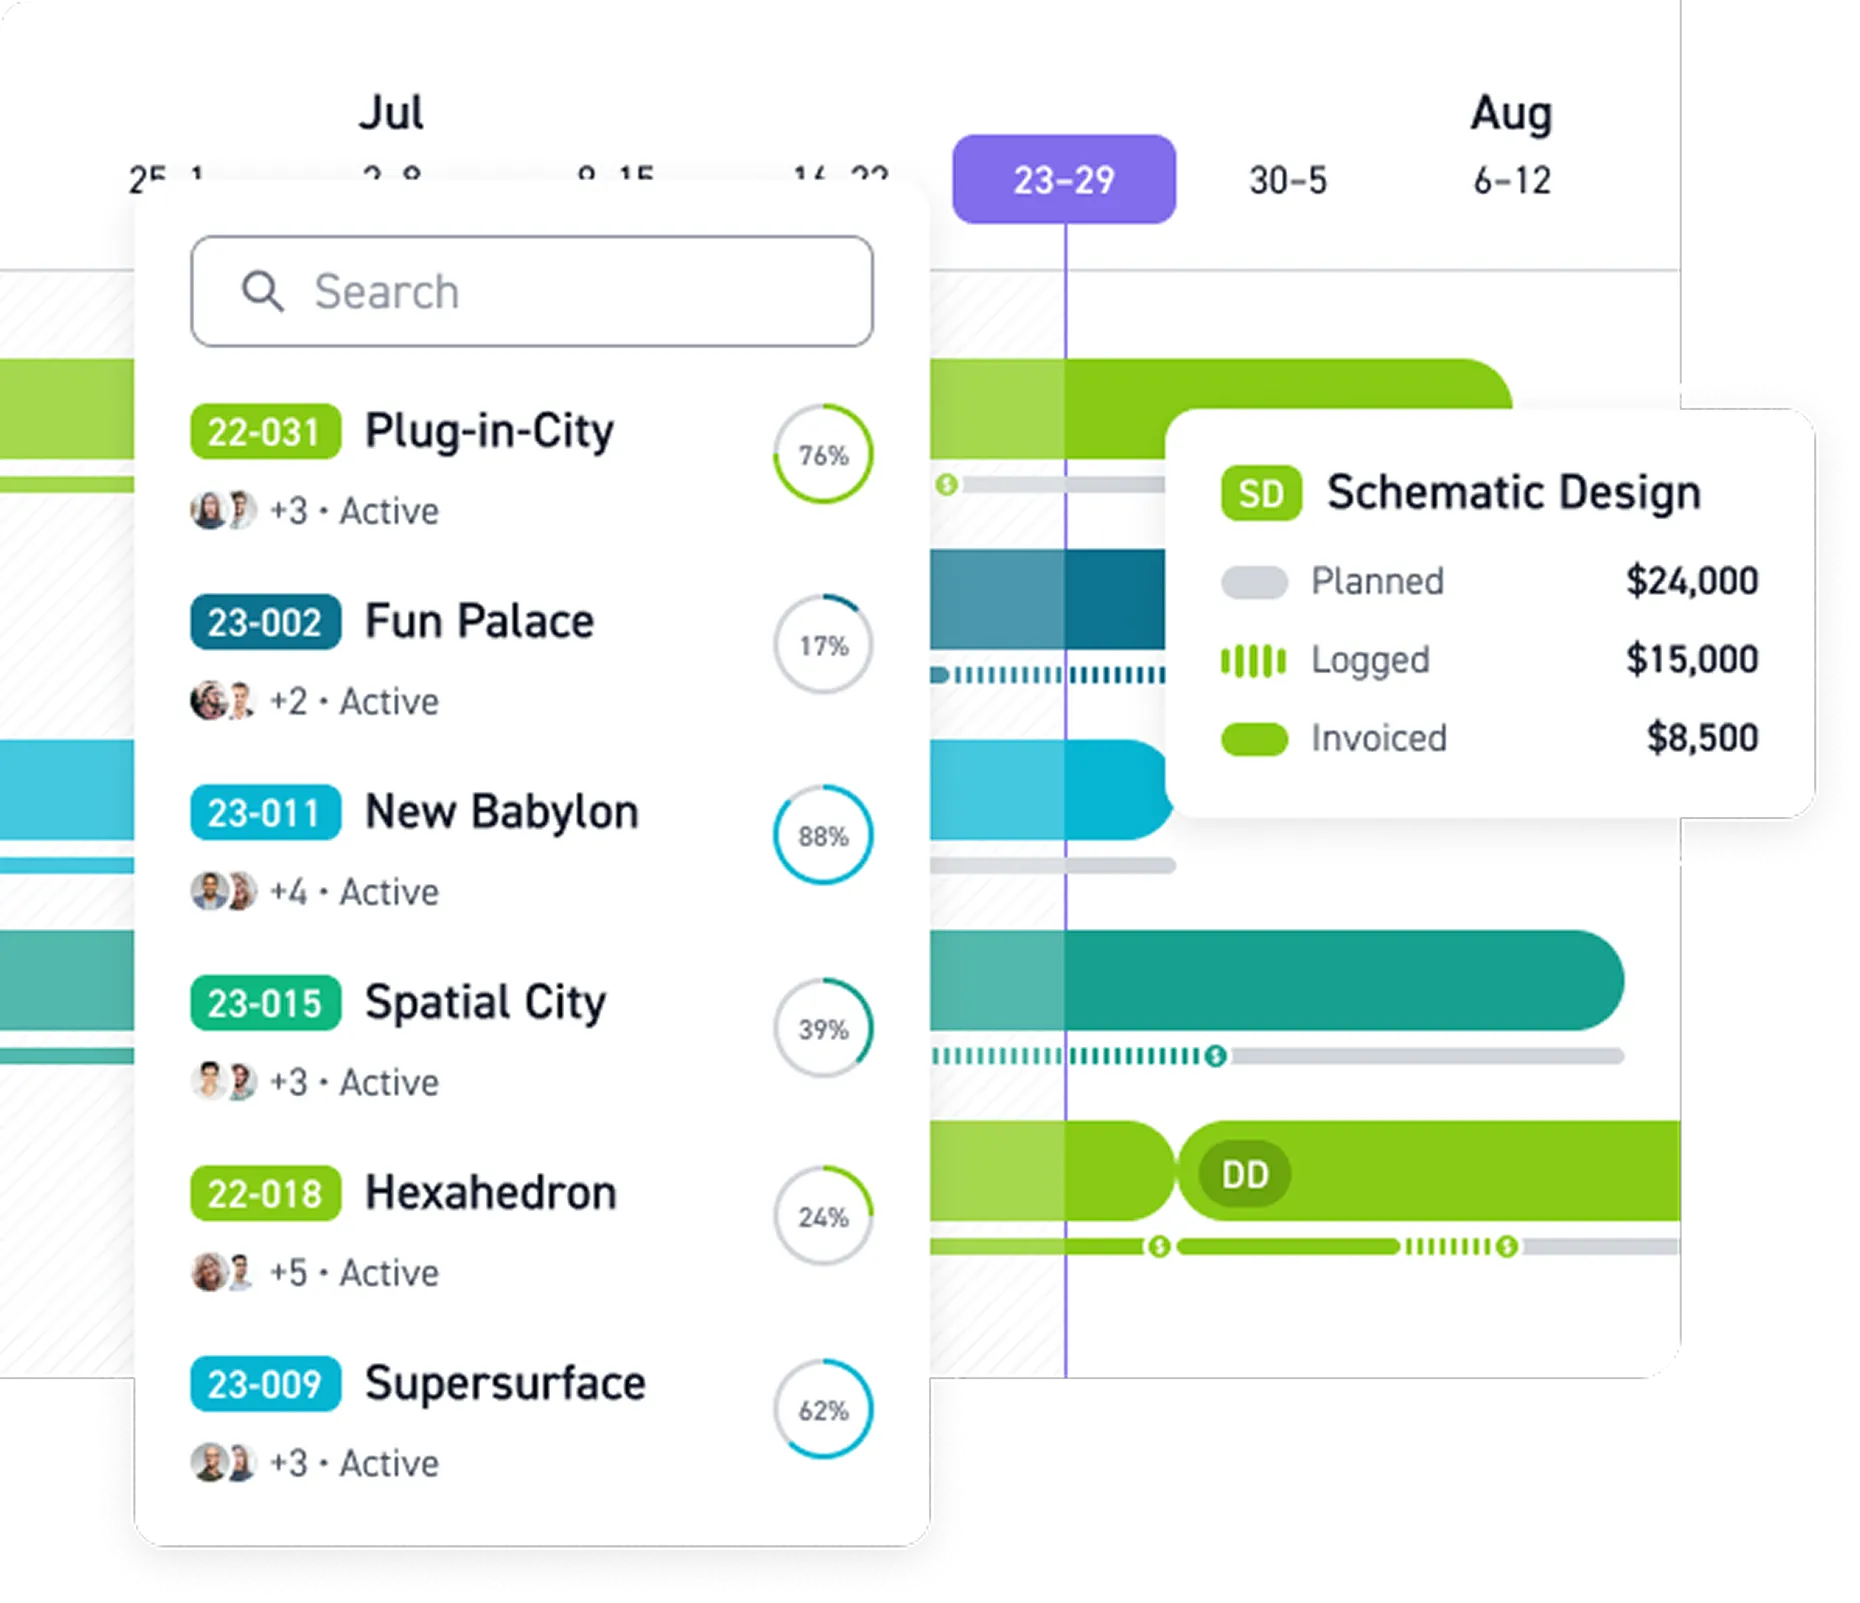
Get every insight your firm needs, all in one place.



















Read more



Frequently asked questions
How does weighted revenue forecasting work?
Monograph applies a probability weight to each lead based on its pipeline stage, then rolls those up into a projected revenue view that’s updated automatically as leads move. This gives your firm more realistic revenue projections based on what's actually happening in your sales pipeline and helps support more accurate financial forecasting.
What does Capacity vs. Pipeline actually show?
It compares your team's available bandwidth against the work likely to land from your current pipeline so you can spot under- or over-capacity before it becomes a problem. This helps with resource planning and resource allocation by showing when you may need to hire, rebalance workloads, or pursue more work.
Can I see win rate broken down by client or project type?
Yes. Monograph lets you slice win-rate data by source, stage, and client type so you can identify patterns and double down on the pursuits most likely to close. Historical data and conversion rates can also help your team understand historical performance, make more informed sales forecasting decisions, and identify opportunities for repeat work, recurring revenue, or an upsell with existing clients.
Does forecasting require manual data entry to stay current?
No. Forecasts pull live from your pipeline. As leads progress or are updated, your forecast updates automatically. Keeping financial data and pipeline information current improves data quality and gives principals and project managers a shared, reliable view for financial planning, budgeting, financial forecasting, and strategic decision-making.
What is revenue forecasting for architecture and engineering firms?
Revenue forecasting is the process of estimating how much revenue your firm expects to generate over a future period. For A&E firms, that means looking at active projects alongside potential work in the sales pipeline to understand what's likely to come in. Accurate revenue forecasting can help firms improve budgeting, resource planning, cash flow management, profitability, and overall business strategy. Firms may approach this using top-down forecasting from total firm targets or bottom-up forecasting built from individual project budgets.
How can historical data improve revenue forecasts?
Historical data can show how your firm's past opportunities, win rates, project types, and clients have performed. Comparing historical performance with your current sales pipeline can help you create more informed revenue projections, identify trends, and understand which types of work are most likely to contribute to future profitability. Looking at changes in revenue and growth rate over time can also give firms more context when planning for future performance — insights that complement traditional quantitative methods like moving averages or time series analysis.
How does revenue forecasting help with cash flow, staffing, and profitability?
Revenue forecasting gives firms an earlier view of potential gaps or increases in future work, helping leadership make more informed decisions about cash flow, hiring, and resources. By comparing revenue projections with capacity, project scope, and staffing needs — while also considering factors like seasonality and market conditions — firms can improve scenario planning, manage risk, and make proactive decisions that support profitability and sustainable growth.