
Easy profit and revenue reporting
Combine revenue, labor, and consultant costs into one real-time profit picture without spreadsheets or manual reporting.
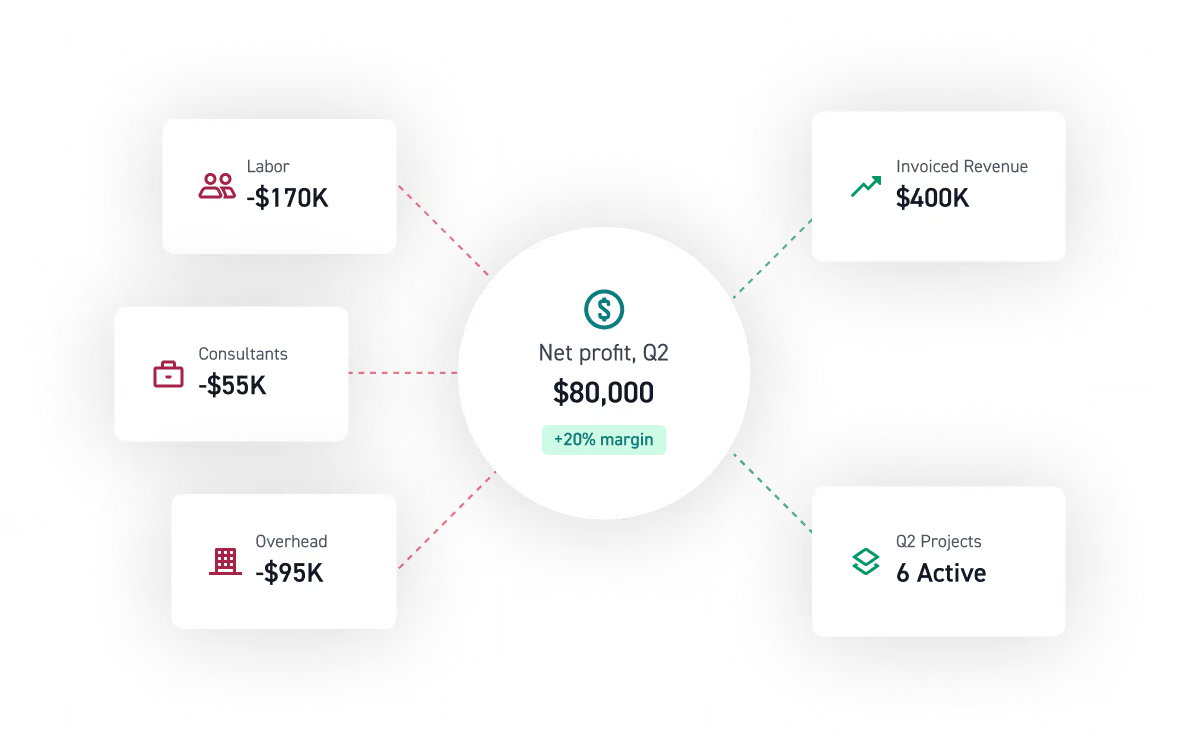
Understand profitability, at a glance
See real profitability
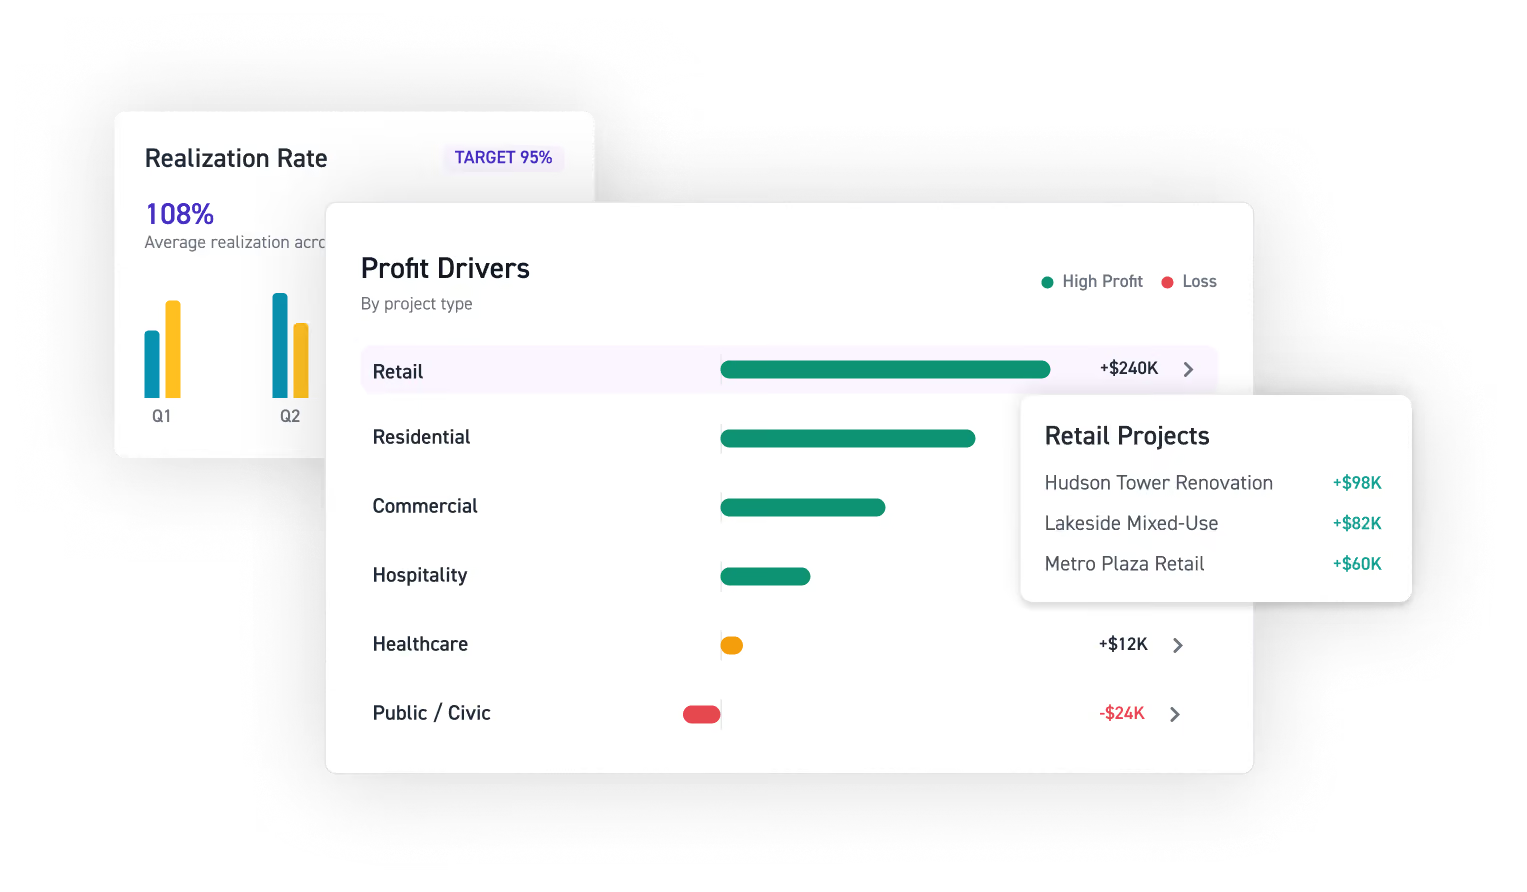
Know what's driving margins
Forecast future profit
“Monograph has given us more accurate tracking of timeline vs. budget which has led to 20% profit rates on most projects. Payroll, which used to take up a large part of our day, is now wrapped up in a couple of hours.”

Get profitable, and stay that way
Get straight answers to the questions that actually matter: are you profitable, why, and learn what to change to improve it.
See profitability
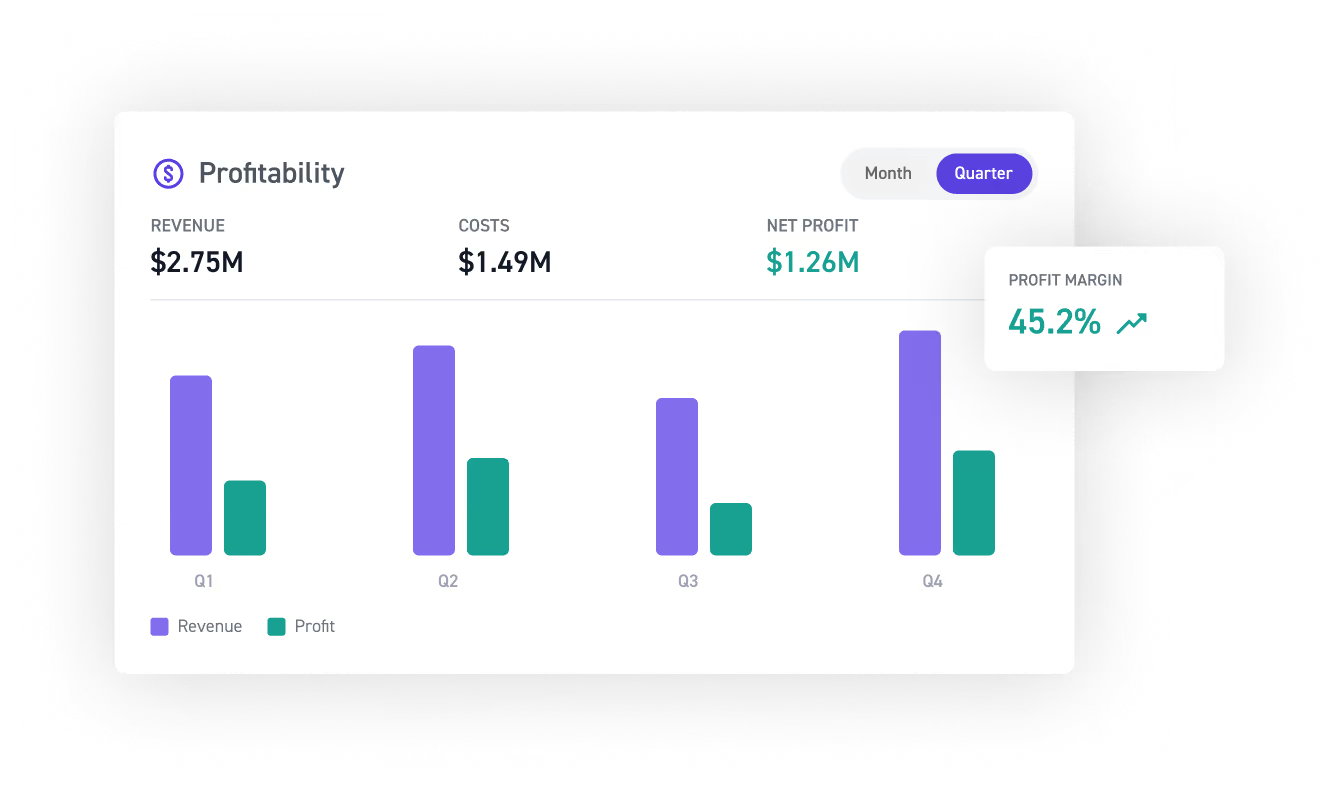
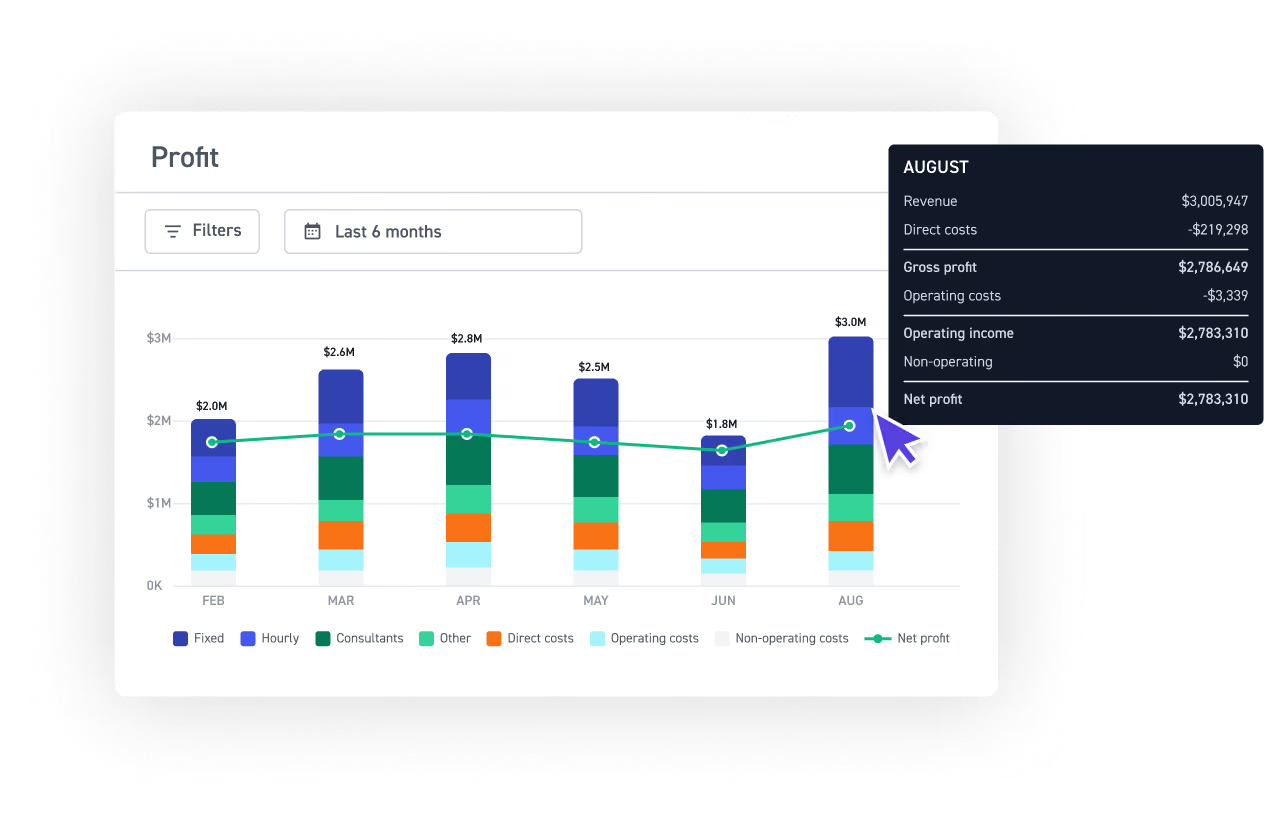
See true profit by combining real revenue and salary costs, past results and future forecasts, all in one report. No need for manually reconciling numbers.
Know what future work will earn
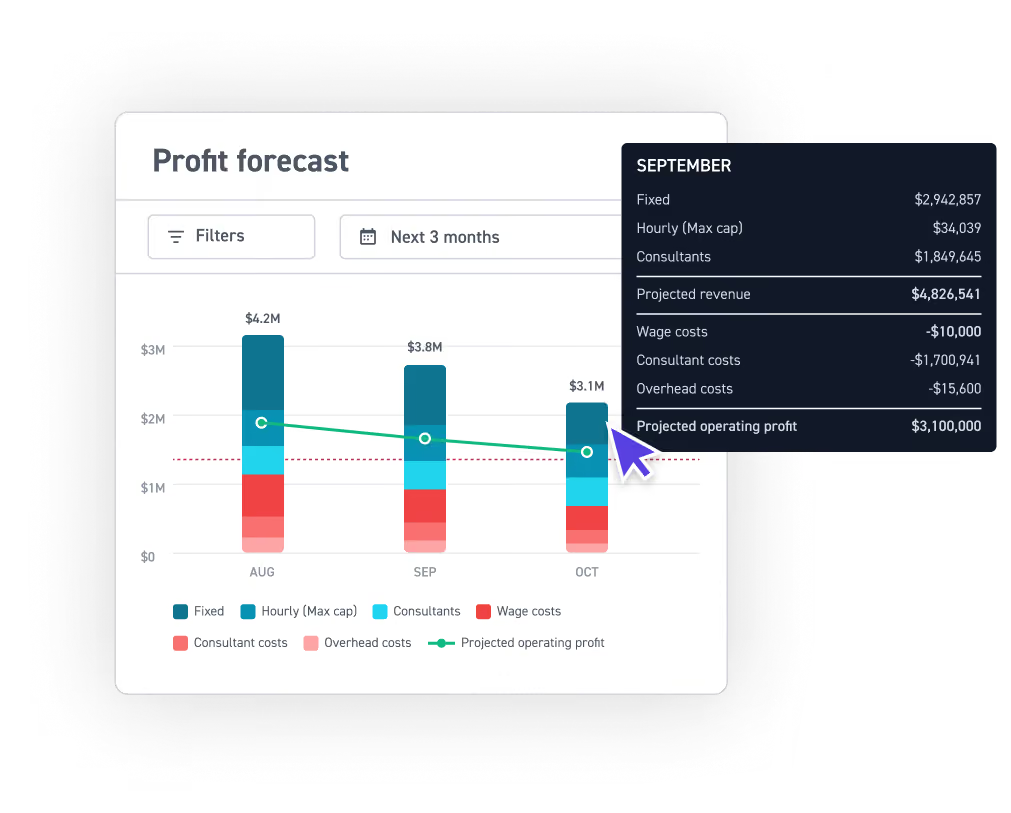
Compare forecast revenue and costs before committing more people or taking on more work.
Faster insights with AI
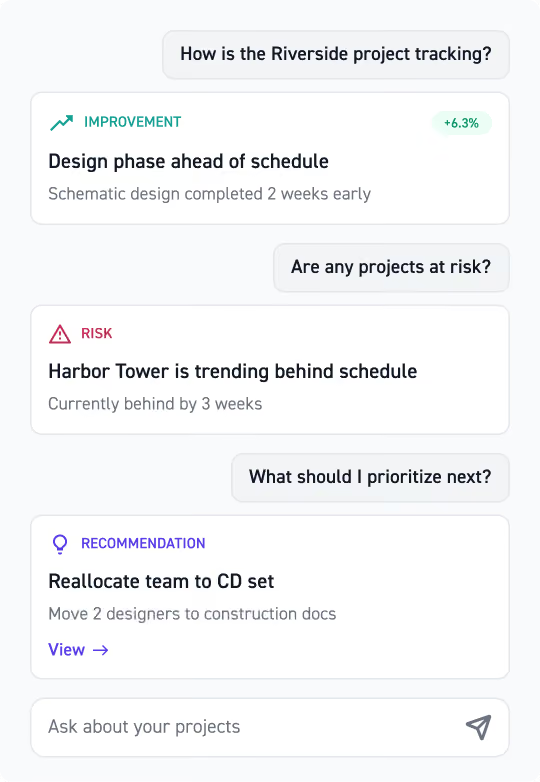
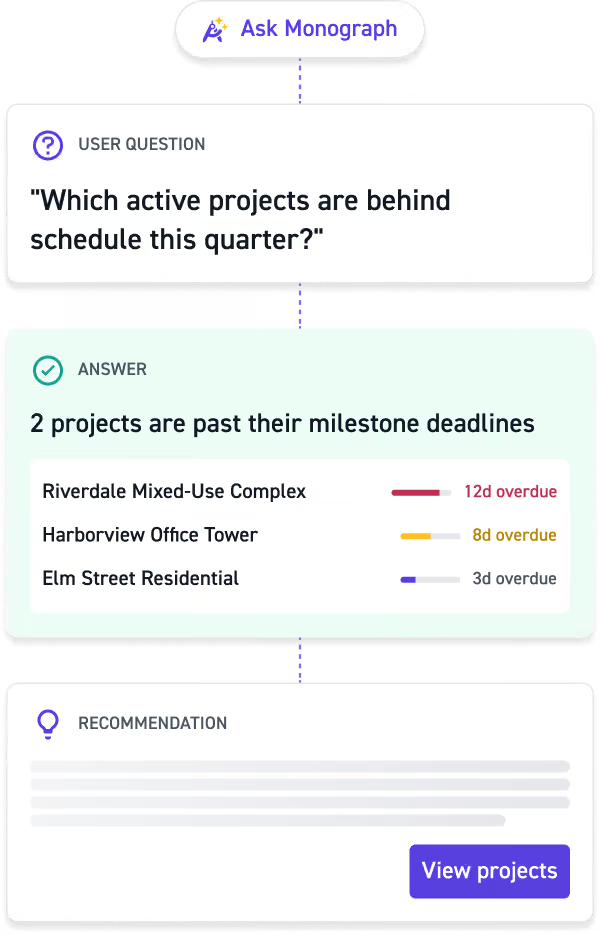
Ask plain-language questions to get answers on profitability. Spot opportunities to increase profit that you'd otherwise miss without needing a financial analyst.
Start protecting your margins
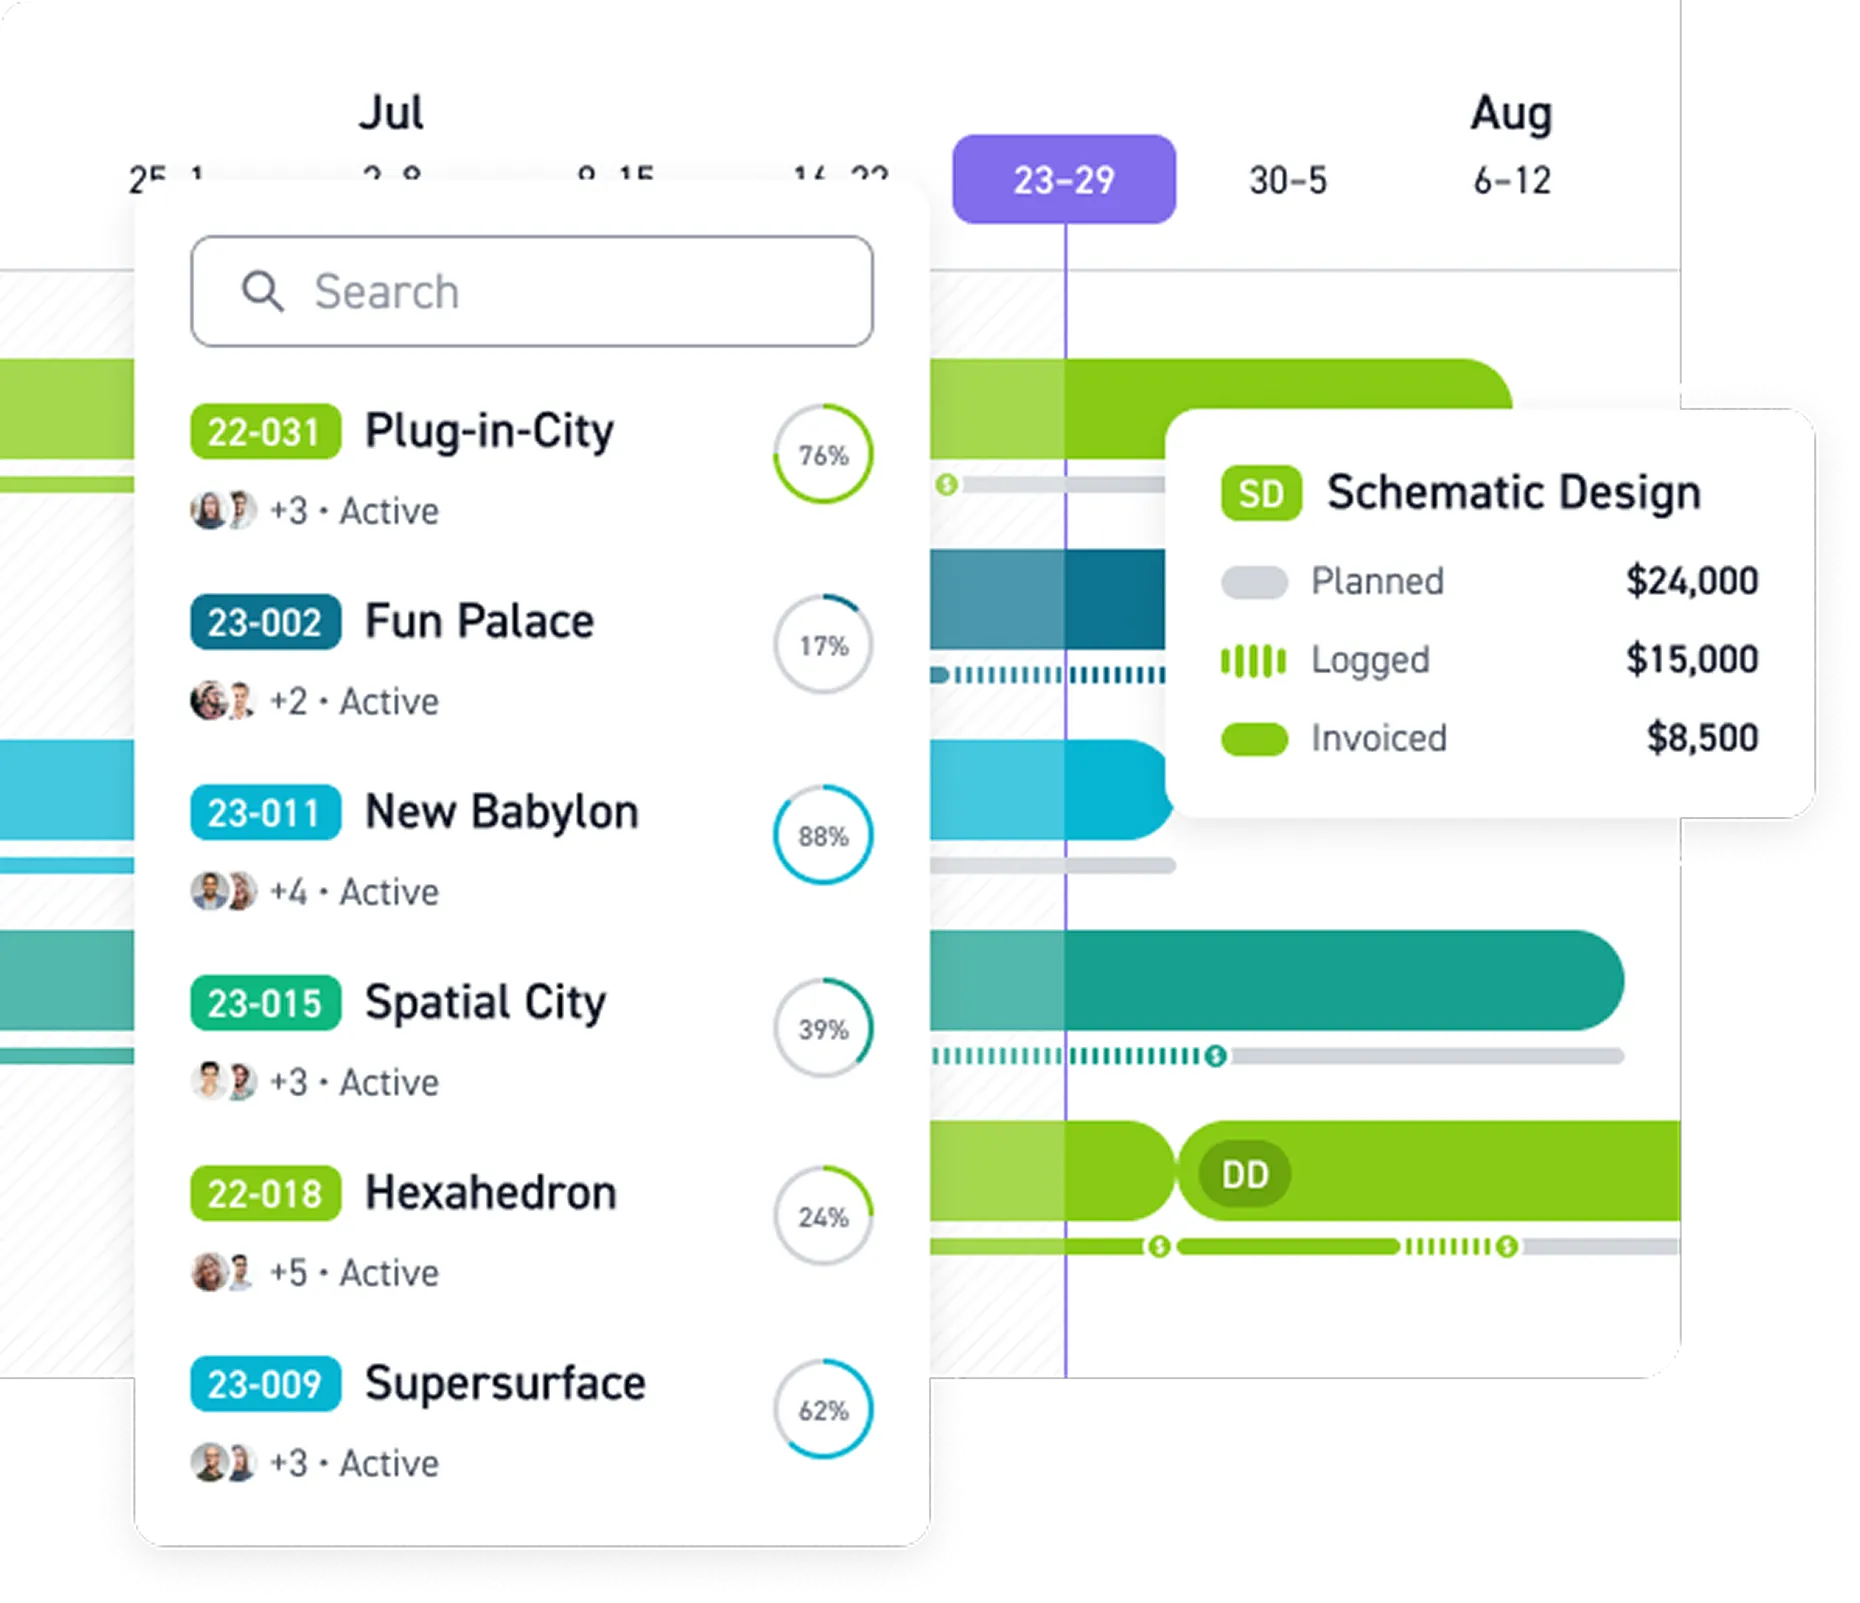
See how profit & financial reports help your firm grow profitably, project after project.



















Read more


Frequently asked questions
What's the difference between Profit Report and Profit Drivers?
The Profit Report shows your firm's overall project profitability over time, combining project revenue from invoicing with labor costs and project costs to calculate profit margins. Profit Drivers takes that further with profitability analysis broken down by category, client, phase, or person — helping firms run project profitability analysis to understand which work drives the highest return on investment.
How far back does historical data go?
Up to two years before your subscription start, if compensation, invoices, and cost data are complete. Accurate historical data helps firms benchmark profitability metrics like net profit margin, gross profit margin, and utilization rate over time — insights that are difficult to maintain in spreadsheets or general accounting software like QuickBooks or Xero.
How accurate are the forecasts?
Forecasts pull from active project budgets, staffing schedules, and revenue scheduling. Keeping time tracking, expense tracking, and compensation data current improves reliability. For firms managing retainer and fixed-fee work alongside hourly projects, up-to-date time entries and hourly rates ensure forecasted project revenue and cash flow reflect what's actually happening.
Who can access these reports?
Admins have full access by default. Others need View Financial Reports permission enabled. This keeps sensitive profitability reports and financial reporting — including labor costs, cost rates, and profit margins — visible only to those responsible for project financials and firm-level decision-making.
What if compensation isn't entered for someone?
Missing compensation affects Profit Report and Profit Forecast accuracy because labor costs are calculated from salary data and logged billable hours. Every team member needs compensation on file for reliable project profitability, direct costs, and profitability metrics across your profitability reports.
How does Monograph calculate project profitability?
Monograph connects time tracking, timesheets, invoicing, and expense tracking to calculate project profitability at the phase level. Project revenue (from invoices) minus direct costs (labor costs from time entries × cost rate, plus consultant and expense costs) gives you gross profit per project. This is the profitability analysis that spreadsheets and general project management tools can't provide without significant manual work.
How does profit reporting help prevent budget overruns and scope creep?
By comparing your project budget against actual project costs, billable hours, and budget burn in real time, project managers can identify scope creep and budget overruns before they erode profit margins. Combined with resource planning and resource allocation data from staffing, firms get a complete picture of whether project planning assumptions are holding — or whether resource management adjustments are needed to protect profitability.
How is Monograph different from QuickBooks, BigTime, or Scoro for profitability reporting?
Monograph is built specifically for architecture and engineering firms, connecting project budgets, time, labor costs, expenses, consultant costs, and revenue to show project-level gross profit and margin as work progresses. Firm-level reporting provides a broader view of net profit. Monograph’s A&E-specific approach connects profitability reporting with the projects, phases, and operational data firms manage every day.