

Half the fee is spent. Is half the work done? On a fixed-fee engineering contract, the distance between those two numbers is where profit disappears, and traditional budget reports can't measure it. Median operating profit on net revenue fell to 16.7% in the latest annual A&E study, retreating from the prior year's record high. There isn't much margin left to give away to overruns you didn't see coming.
Earned value management (EVM) measures that distance directly. PSMJ reports that most firms have heard of EVM but few use it, relying instead on subjective progress reports and a close watch on what's been billed and what's left in the contract. That approach can get you close. It isn't a repeatable process.
The Three Numbers That Replace Guesswork
Comparing actual costs to planned costs tells you almost nothing on its own, because the relationship between spending and progress stays unknown. Federal project guidance makes the same point: without a measure of physical progress, plan-versus-actual comparisons can be misleading. EVM adds the missing third measurement.
Every earned value calculation runs on three values measured on the same cost basis:
- Planned Value (PV): the portion of the approved internal cost budget you planned to spend by now. The total approved cost budget is the budget at completion (BAC); keep the fixed contract fee separate for margin calculations.
- Earned Value (EV): the budgeted cost of work actually completed. If you're 20% through work with a $50,000 approved cost budget, EV is $10,000, regardless of what you've billed or spent.
- Actual Cost (AC): everything actually spent to date on the same cost basis, which for a design firm is mostly labor.
Labor is why EVM fits engineering practice so well. It accounts for roughly 90% of cost on a professional services project, so managing labor hours against earned progress is managing the whole budget. Your weekly timesheets already contain most of the raw data.
From Timesheets to Early Warnings
Three derived metrics do the diagnostic work, each comparing values measured on that consistent cost basis:
- Cost Performance Index (CPI) = EV ÷ AC. Below 1.0, you're spending faster than you're earning. A CPI of 0.83 means every dollar spent produced 83 cents of budgeted work.
- Schedule Performance Index (SPI) = EV ÷ PV. Below 1.0, you're behind plan.
- Estimate at Completion (EAC) = BAC ÷ CPI. Your projected final cost if the current burn rate holds.
Run the numbers on a fixed-fee project with a $100,000 approved internal cost budget at week 20 of 40. The plan says you should be 50% complete (PV = $50,000), your project manager assesses 40% complete (EV = $40,000), and timesheets show $60,000 in actual cost. CPI is 0.67, SPI is 0.80, and EAC is $150,000.
A project that looks vaguely behind and 60% spent is actually forecast to exceed its cost budget by $50,000. Compare that projected cost with the fixed contract fee to calculate the effect on margin. A practical trigger for engineering firms: when CPI drops below 0.9 for two straight weeks, intervene.
The First 20% of the Project Sets Your Final Cost
PMI research found the cumulative CPI rarely changes by more than 10% once a contract is 20% complete, and in most cases it only worsens from there. If CPI reads 0.80 at 30% completion, the best final CPI you can expect is roughly 0.88, meaning an overrun of at least 13.6% is already locked in. That finding turns EVM from a post-mortem into a forecast: the number you calculate a quarter of the way in is close to the number you'll live with.
The firm-level cost of not looking shows up in realization. Monograph's 2026 Architecture & Engineering Business Benchmarks Report found baseline firms average 96% realization, losing 4 cents on every dollar of billable time to write-offs and scope creep. The spread between low performers at 83% and top firms at 107% amounts to $24K on a $100K project. (Realization above 100% means a firm invoiced more than the billable value of time logged, typically on fixed-fee projects completed efficiently.)
CPI is the project-level version of that same story. A project running below 1.0 consumes more labor cost than the budgeted cost of the work it delivers, compressing its contribution to your net multiplier long before any write-off appears. Catching it early leaves you options: rescope, renegotiate, or restaff. Catching it at 80% complete leaves you an apology.
EVM Without the Compliance Overhead
Formal EVMS compliance under ANSI/EIA-748 applies to large federal cost-type contracts, and defense acquisition rules actually discourage EVM on firm-fixed-price contracts at any dollar value. Since architect-engineer services contracts are typically firm-fixed-price, a small engineering firm sits outside mandatory compliance entirely. What remains is the useful part: a lightweight system built on PV, EV, and AC with phase-level cost budgets and weekly timesheets.
The hardest input is percent complete, because self-reported progress drifts. You've seen the task that sits at 90% done for three weeks straight. Structured earning rules cut the subjectivity:
- Weighted milestones: earn value at defined phase deliverables and client approvals, the natural fit for phase-based A&E work
- 0/100 rule: no credit until a task is fully complete, for short discrete deliverables
- 50/50 rule: half credit at task start, the rest at completion
- Hours logged as a proxy: workable as an initial baseline, but time spent doesn't always equal progress made
Anchoring phase percentages to formal client review milestones keeps the estimates honest. Cadence matters as much as method: weekly reviews catch problems early enough to fix them, while monthly reviews often arrive too late for course correction on fixed-fee work. And with 43% of A&E firms still running accounting and invoicing on spreadsheets, the real barrier is rarely the math. It's getting current data without manual assembly.
That visibility has practical effects. One customer case study documented the results at Red Brick Consulting, a seven-person engineering and architecture firm that previously used Excel: 25% less budget overage and 25% less time spent on administration after adopting Monograph.
Tracking Earned Value in Monograph
Monograph's project tracking brings together the time, phase-budget, and financial inputs teams can use for lightweight EVM analysis. Each time entry records hours against projects and phases, giving teams current logged-fee and budget data instead of waiting for a month-end reconciliation. Pair that data with a consistently assessed percent complete and an internal cost basis to calculate earned value.
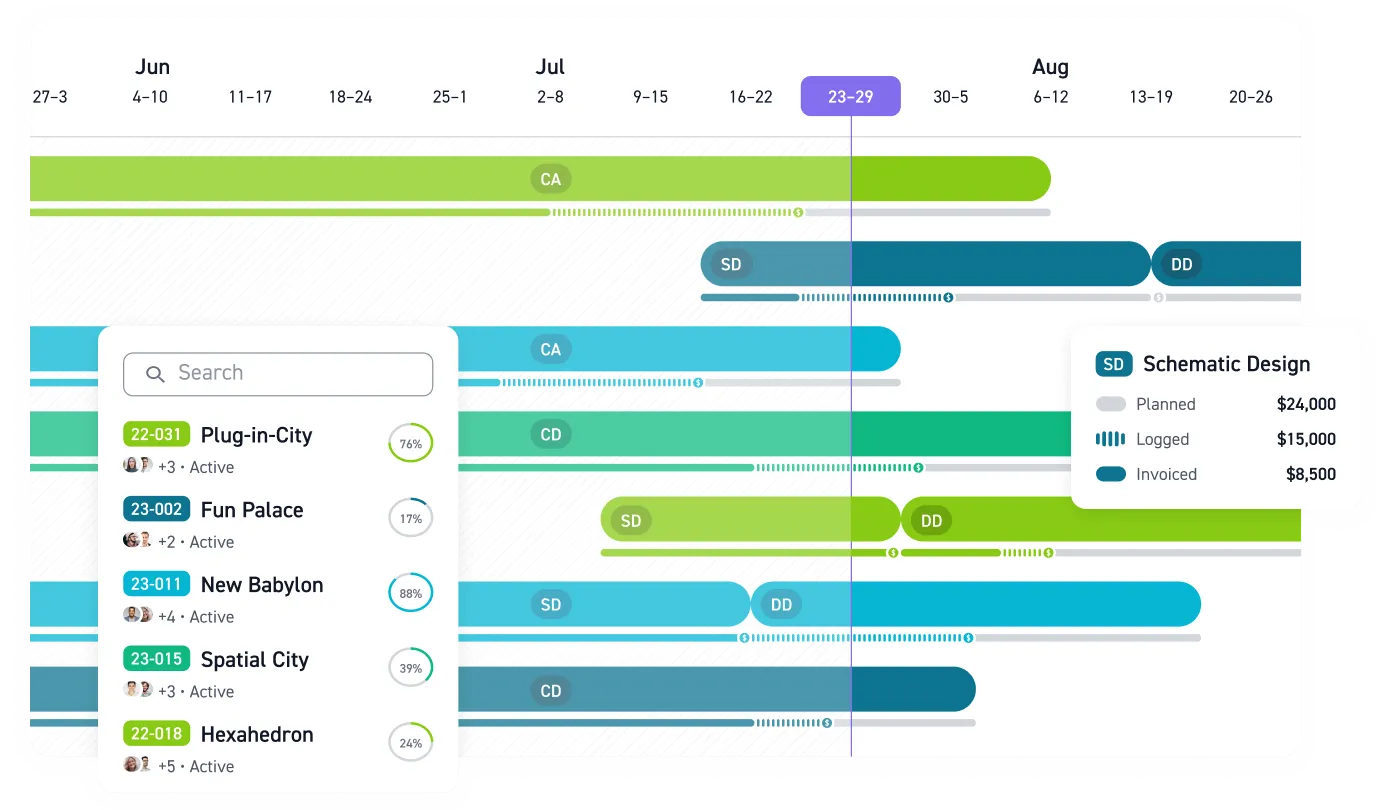
Monograph's MoneyGantt™ is its signature visual innovation, turning that data into instant visual intelligence by showing budget-to-cash progression (planned to logged to invoiced to paid) alongside your project timeline. Around it, three capabilities support the review loop:
- Project performance can be reviewed across staffing, timesheets, and invoices, including by phase or person
- Dashboard alerts and weekly insights help identify phases and projects that are off track
- AI-assisted project setup can turn contracts and milestone spreadsheets into structured budgets and schedules
For the 13,000+ architects and engineers across 1,800+ firms who use Monograph, the inputs for earned value analysis can come from the same system used to log time and track project finances rather than a separate spreadsheet exercise. The inputs for CPI on your current projects are already available a quarter of the way in. The only question is whether your team reviews them.
Catch Margin Loss Before It Becomes a Write-Off
Start with one project. Choose an active fixed-fee job, establish PV, EV, and AC by phase on the same internal cost basis, and review CPI every week. Keep the contract fee separate, then compare it with projected final cost to understand the effect on margin. That gives you a practical test of EVM without turning your firm into a federal compliance office.
Project managers can review CPI by phase and intervene early. Operations leaders can establish the weekly review cadence, while principals and owners can prioritize the projects most likely to lose margin. If assembling those inputs still requires rebuilding data in a spreadsheet, Monograph connects timesheets, phase budgets, and project progress in one place.
The overrun is already forming. See it early enough to act. Book a demo.
Frequently Asked Questions
Is EVM too complex for a small engineering firm?
No. Start with one fixed-fee project and track PV, EV, and AC at the phase level on the same internal cost basis. Pick one consistent earning rule, calculate CPI weekly, and use the result to guide project decisions rather than trying to reproduce a formal EVMS compliance program.
Does EVM work on fixed-fee engineering contracts?
Yes. Fixed-fee work is where the gap between spending and completed work can erase margin. EVM shows whether labor cost is rising faster than the budgeted cost of earned progress. Keep the contract fee separate from the EVM cost measures, then compare it with projected final cost to calculate the margin effect, even when billing and the remaining contract value still look acceptable.
How do we estimate percent complete without guessing?
Tie progress to observable phase deliverables, client approvals, or another structured earning rule. Weighted milestones work well for phase-based engineering projects, while the 0/100 or 50/50 rules fit shorter tasks. Use the same method from week to week so the trend stays meaningful.
Can we start with the timesheet data we already have?
Yes. Weekly timesheets provide most of the actual-cost data, especially because labor makes up most professional services project costs. Pair those hours with phase-level internal cost budgets and a consistent measure of completed work, then review CPI weekly instead of waiting for month-end reconciliation.
Data was collected as of April 2026.