
An engineering firm can post a net labor multiplier above 3.0 and still barely make money. A firm carrying a 210% overhead rate needed a 3.10 break-even multiplier, so an achieved 3.19 left just 5% profit. The multiplier looked healthy on its own. It only signals profit when you know what to compare it against and which blind spots apply to your firm.
The Net Labor Multiplier Is a Break-Even Test
The net labor multiplier is net operating revenue divided by direct labor cost: how many dollars the firm earns for every dollar of raw salary charged to projects. Net operating revenue means gross fees minus pass-through project costs:
- Subconsultant fees paid to outside firms
- Reimbursable project expenses such as printing and travel
- Other direct costs incurred on behalf of clients
What remains is the fee your staff earned. Direct labor means raw salary charged to projects only. Fringe benefits, bonuses, and PTO are carried in overhead.
The number becomes a profit signal only next to your break-even rate, which is your overhead rate plus 1.0. Clear break-even and the work is profitable. Fall short and you are losing money on it. PSMJ's 2026 survey reports a median 3.43 achieved multiplier against a 3.29 median target and a 167.6% overhead rate. Survey respondents skew toward firms that benchmark actively, so 3.43 is not a universal bar. Low-profit and loss-making firms still post a 3.05 median.
Direct Labor Multiplier: Same Formula, Project-Level Lens
Direct labor multiplier, net labor multiplier, and net multiplier all name the same calculation: net revenue divided by direct labor. By convention, direct labor multiplier describes a project while net multiplier describes the firm. Calculate it at the project level, then roll it up by project manager, department, and firm.
When direct labor rises while net revenue stays flat, the falling ratio flags scope leakage while there is still time to act. The likely causes are project overruns, fees too thin for the scope, or change orders that never got invoiced. Billing rates come from your overhead and break-even rates. The multiplier measures results after the fact. Use it to size fixed-fee labor budgets by dividing the fee by your net multiplier.
What the Multiplier Can't See
Three blind spots explain how a healthy-looking multiplier still hides a bad year:
- Overhead. Break-even climbs point for point with your overhead rate, so the same multiplier can be marginal at one firm and comfortable at another.
- Utilization. A construction services group at 90% utilization and a 2.1 multiplier outperforms an engineering group at 63% and 2.8, with revenue factors of 1.89 and 1.76.
- Gaming. Managers can inflate a project's multiplier by restricting charges to it, which pushes the cost into indirect labor.
Sloppy job costing causes the same damage. Any hour that goes unrecorded understates direct labor and overstates the multiplier. Mileage or reimbursables coded to the wrong bucket also push the reported figure higher. One firm's 3.1 was actually 2.9.
Utilization and the net multiplier usually move in opposition. Staff who pad project hours lift utilization while eroding the multiplier. The bottom line does not improve.
Revenue Factor: A Harder Metric to Game
The revenue factor multiplies utilization rate by net multiplier, or net service revenue divided by total labor cost, billable or not. Also called the payroll multiplier, it has the highest correlation with firm profits among standard A&E metrics. Hitting the target requires utilization and the net multiplier to hold at the same time. Because it includes total labor cost, revenue factor reduces the incentive to shift project hours into indirect labor, but it still depends on complete time and revenue records.
A project manager at 70% utilization with a 4.2 multiplier produces a 2.94 revenue factor. A second staff member at 85% utilization with a 3.0 multiplier produces 2.55. The first unit earns more on every labor dollar despite lower utilization.
The industry median is 1.86. The 2026 benchmark puts the net payroll multiplier at 1.94, against best-practice targets of 1.80 to 1.95. Sitting below 1.80 points to weakness in the overall revenue-to-labor ratio rather than merely how project hours are classified, provided time and revenue records are complete.
Reading the Numbers as an Engineering Firm
Data from Monograph's 2026 Architecture & Engineering Business Benchmarks Report reveals engineering firms put 70% of spend into employee costs and 5% into consultants, versus 56% and 17% at architecture firms. In-house delivery keeps more gross revenue as net revenue but loads the denominator with direct labor, compressing the multiplier relative to architecture peers. Rising consultant spend warrants a margin check. It may reflect specialty expertise or capacity needs, but unmarked-up outsourced work can give away margin.
Pairing utilization with the multiplier gives you a four-quadrant read:
- High utilization, high multiplier: pricing holds and scopes were estimated honestly
- High utilization, low multiplier: the team is busy at prices that do not cover the work
- Low utilization, high multiplier: pricing is strong and you have capacity sitting idle
- Low utilization, low multiplier: overspending, underbilling, or weak demand
These ratios prevent losses only when reviewed monthly. When answers require hunting through spreadsheets, QuickBooks, timesheets, and email, margin pressure surfaces late. By then, the window to intervene has closed.
See What Actually Drives Your Firm's Profit
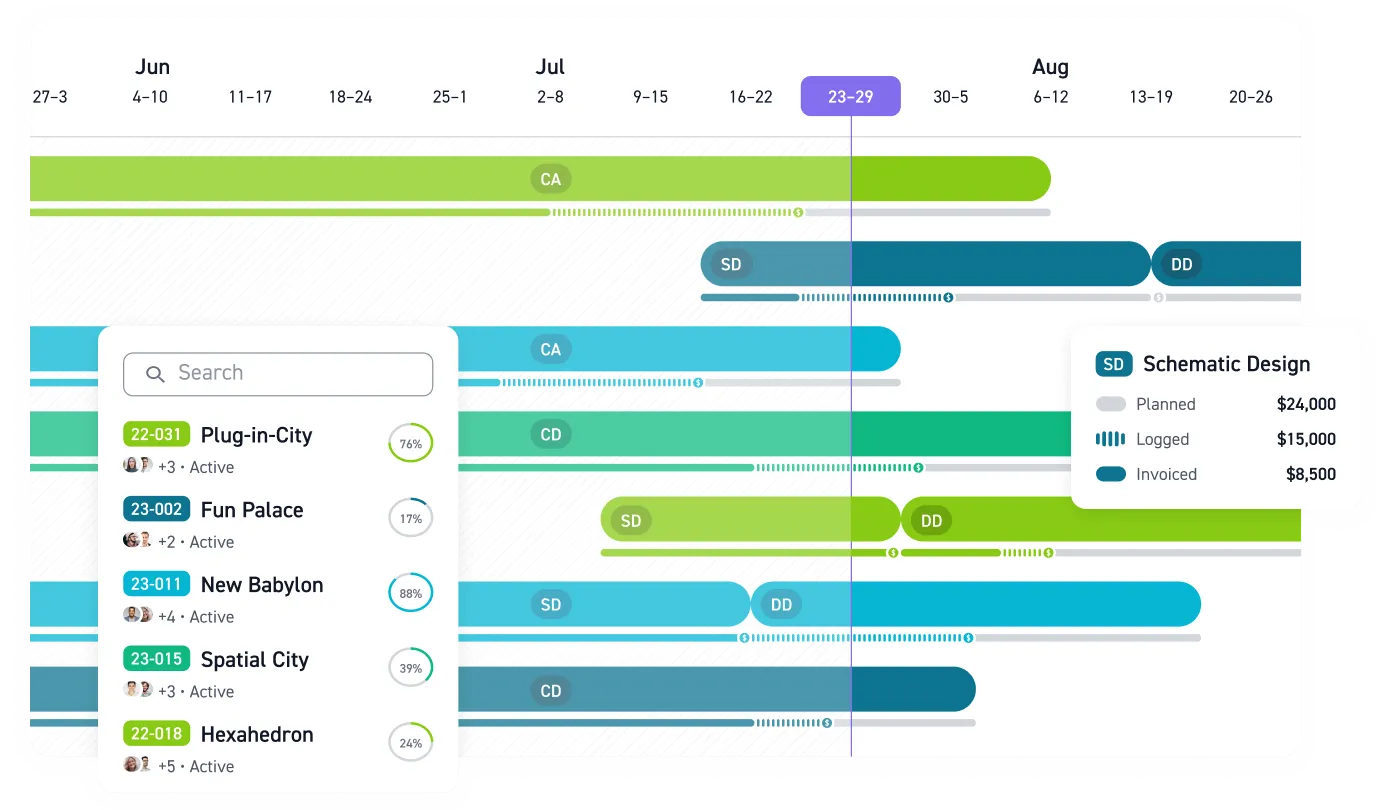
Stop managing profit from stale numbers. Monograph's financial dashboards provide visibility into utilization, realization, planned-versus-logged fees, and project-level fee burn by phase. That visibility helps teams identify budget risks before they become larger financial problems. Garrison Architects, a nine-person New York firm, reported a 1.5x faster billing process and 2.5x faster time-to-payment after moving to Monograph.
Run the numbers now. Pull last quarter's indirect expenses, compute your overhead rate, add 1.0, and hold your trailing-12 multiplier against it. Then compare utilization and revenue factor so your team can see whether pricing and labor are holding together. Book a demo with Monograph.
Frequently Asked Questions
Is a 3.0 net multiplier actually good?
Only if it clears your firm's break-even multiplier, which is your overhead rate plus 1.0. Review it beside utilization and revenue factor rather than treating 3.0 as a universal target.
Are direct labor multiplier and net multiplier the same thing?
Yes. Both divide net revenue by direct labor. Direct labor multiplier usually describes a project, while net multiplier describes the firm-wide result.
Should we track net multiplier or revenue factor?
Track both. Net multiplier shows whether fees cover direct labor after overhead. Revenue factor tests whether utilization and multiplier hold at the same time.
How often should we review these metrics if our timekeeping is inconsistent?
Review them monthly, but fix timekeeping first. Unrecorded hours understate direct labor and make the multiplier look stronger than it is.
Data was collected as of April 2026.